'Reverse Engineering'에 해당되는 글 12건

  1. 2009.01.26 ASPROTECT UNPACKER by CEOinIRVINE
  2. 2009.01.26 PhantOm Plugin 1.54 by CEOinIRVINE
  3. 2009.01.24 W32DASM Disassembler by CEOinIRVINE
  4. 2009.01.24 Intro to Reverse Engineering-Part 2 by CEOinIRVINE
  5. 2009.01.24 Intro to Reverse Engineering - No Assembly Required by CEOinIRVINE
  6. 2009.01.20 Common Hacking Tools by CEOinIRVINE
  7. 2009.01.06 DeFixed_Edition.zip by CEOinIRVINE
  8. 2008.12.27 Reverse Engineering and Function Calling by Address by CEOinIRVINE
  9. 2008.12.22 Reverse Engineering (BASIC) by CEOinIRVINE
  10. 2008.11.06 Basic of Reverse Engineering by CEOinIRVINE

ASPROTECT UNPACKER

Hacking 2009. 1. 26. 16:28
http://letitbit.net/download/3ff267103447/stripper-v2.13b9.rar.html
http://letitbit.net/download/4fecc3897007/stripper-v2.07f.zip.html
http://letitbit.net/download/079257596467/stripper-v2.11rc2.zip.html
http://letitbit.net/download/3110cd452204/CASPR-v1.0.12.rar.html
http://letitbit.net/download/25129e80979/ASProtect.zip.html
http://letitbit.net/download/615199657920/Aspr-v2.XX-unpacker-v1.0E.rar.html
http://letitbit.net/download/fcf976186402/ASPriNF-v1.6-beta.rar.html
http://letitbit.net/download/e8ace655459/stripper-v2-1-.11rc2.zip.html

'Hacking' 카테고리의 다른 글

Themida and WinLicense 2.0.1.0 (Unpacking) by LCF-AT  (0) 2009.01.26
GUnPacker.V0.4 generick unpacker & helper  (0) 2009.01.26
Kernel Detective v1.2  (0) 2009.01.26
Imm_PhantOm Plugin 1.54  (0) 2009.01.26
PhantOm Plugin 1.54  (0) 2009.01.26
Posted by CEOinIRVINE
l

PhantOm Plugin 1.54

Hacking 2009. 1. 26. 06:16

Plug-in for concealment OllyDbg (plugin with the driver). Helps from following methods of detection:

// driver - extremehide.sys

[+] NtQueryInformationProcess.
[+] SetUnhandledExceptionFilter.
[+] OpenProcess.
[+] Invalid Handle.
[+] NtSetInformationThread.
[+] RDTSC.
[+] NtYieldExecution.
[+] NtQueryObject.
[+] NtQuerySystemInformation.
[+] Windows hide.
[+] GetProcessTimes.
[+] NtSetContextThread.

// plugin - PhantOm.dll

[+] PEB BeingDebugged.
[+] PEB NtGlobalFlag.
[+] GetStartupInfo.
[+] Process Heaps.
[+] GetTickCount.
[!] Protect DRx.
[!] Hide DRx.
[!] Fake Windows version.
[!] Custom Handler.
[+] BlockInput

Whats new: - 1.20

[*] Added own handling of exception (C0000005).
[*] Added option for the title change of the main window.
[*] Added own handling of exception (OUTPUT_DEBUG_STRING_EVENT).
[*] int 3 at EP correctly removed.
[*] Added interception of BlockInput. (WinXP only)
[*] Added own handling of exception (C0000094).
[*] Added hiding of GetStartupInfo.
[*] Fixed bug with changing the options of the plugin.
[*] Added more defense of the driver from detection.

http://vip-file.com/download/0fb19f513060/PhantOm-Plugin-v1-.54.7z.html

'Hacking' 카테고리의 다른 글

Kernel Detective v1.2  (0) 2009.01.26
Imm_PhantOm Plugin 1.54  (0) 2009.01.26
OllyMoreMenu-v1.3c  (0) 2009.01.26
DeFixed_Edition_v2  (0) 2009.01.24
How to Compile Wall Hack  (0) 2009.01.24
Posted by CEOinIRVINE
l

W32DASM Disassembler

Hacking 2009. 1. 24. 08:22

'Hacking' 카테고리의 다른 글

Asprotect UNPACK  (0) 2009.01.24
API & DLL  (1) 2009.01.24
Intro to Reverse Engineering-Part 2  (0) 2009.01.24
Intro to Reverse Engineering - No Assembly Required  (0) 2009.01.24
ASProtect 1.23 RC4 - 1.3.08.24  (1) 2009.01.24
Posted by CEOinIRVINE
l
Intro to Reverse Engineering - Part 2 PDF E-mail
assembler.jpg

In Part 1, Intro to Reverse Engineering - No Assembly Required, we extended the series of coding articles for non-programmers with an area of high interest in the infosec community. We're proud to be able to bring you the highly anticipated follow-up complete with screen shots, sample code and applications. This one is long and detailed, so strap yourselves in for some great educational content.

This paper is designed to outline some essential reverse engineering concepts, tools and techniques - primarily, debuggers and using the debugging process to reverse engineer application functions and algorithms. It is assumed you have knowledge of basic assembly and C programming. An understanding of Win32 programming and API calls is also helpful. This tutorial does not necessarily have to be read in order (although it is strongly advised), as some sections do not contain information that directly relates to subsequent sections. However, if you begin skipping around and find that you have trouble understanding a concept, or feel like you missed an explanation, it would be best to go back to previous sections of the tutorial and read them first.  

Active Image
Active Image del.icio.us

Discuss in Forums

Before we begin... 

The Windows platform was chosen as the focus of this paper. Because of Window's wide-spread use and its closed-source nature, RCE is performed most often on Windows applications. This tutorial is time-consuming and intense, so let's do a quick overview of the topics that will be covered:

  1. Introduction to debuggers, specifically, OllyDbg.
  2. Finding the beginning of the actual code (i.e., the main() function as opposed to code generated automatically by the compiler).
  3. Identifying how source code is translated into assembly instructions.
  4. Locating specific functions and API calls.
  5. Identifying and un-packing basic packers.
  6. Real-time debugging and patching.
  7. Serial fishing.
  8. Self-key generation.
  9. Translating disassembled functions and algorithms into higher-level languages (aka, creating key-generation programs the right way).
  10.  Identifying and exploiting stack-based buffer overflows in closed source programs.

Helpful Resources

There are two directories inside the tutorial's zip file: apps, and source. The apps folder contains the pre-compiled programs we will be working with, and the source folder contains the applicable source code for all programs which I have written for this tutorial.

Several tools will be used throughout this tutorial. While it is helpful to have them all, it is really only necessary to have OllyDbg, as you are expected to be tracing through the example programs as they are being presented in the text; this will facilitate your understanding of the text and code.

1. Olly Debugger - For debugging and disassembly.

2. OllyDump - Plugin for Olly.

3. PeID - For identifying packers/encryptors.

4. Dev-C++ - For compiling source with GCC.

5. ActiveState Perl - For creating some exploit code.

Index

  1. A 30-Second Intro to OllyDbg - Getting to Know Your Debugger

A quick one page introduction to the basic commands for using Olly.

  1. Finding Main() - Compiler Code vs Developer Code

Here we look at some different ways to find the main() function, and also examine the differences between program entry points when they are compiled by different compilers.

  1. EXE Patching

How to temporarily modify assembly instructions in Olly, as well as saving them permanently.

  1. Intro to Keygens and Un-packing

Learn some basics about executable packers, do some more patching, and create our first keygen.

  1. Reversing Key Generation Algorithms - Writing a Real Key Generator

Here we completely reverse a key-validation algorithm, and write a full-fledged key generator in C.

  1. Discovering and Exploiting Buffer Overflows

In the final section of this tutorial, we analyze a program for BOF vulnerabilities, and write some exploit code that allows us to take control of the EIP.

A 30-Second Intro to OllyDbg - Getting to Know Your Debugger

Knowing what tools to use, and how to use them, is critical when reversing software. The tool that will most commonly be used throughout this paper is OllyDbg, a popular Win32 debugger. Olly has many plug-ins and advanced features, but we will learn just the essential commands here.

For those unfamiliar, a debugger allows you to view the assembly instructions of a program as they execute: you can set breakpoints on specific instructions to pause execution, single step through the program one instruction at a time, or just let the program run normally. To get a feel for this, open up test.exe in Olly:

1.jpg

The highlighted instruction ('PUSH EBP') is the entry point of the program. There are four main windows in Olly: the code window in the center, the register window on the right, the stack window in the bottom right hand  corner and the memory dump window in the bottom left corner.

Instructions and data in the code and memory dump windows can be manipulated by highlighting the desired data and pressing the space bar. Stack and register contents can be modified by right clicking them and selecting 'Modify'. To single step one instruction at a time, press the F8 key: you will see that the highlighted line goes to the next instruction, 'MOV EBP,ESP'. If you want to step into a function call, press the F7 key. The F2 key allows you to set a breakpoint on an instruction, and F9 runs the program normally (still 'inside' of Olly though); to pause the program, press F12. The use of these functions will become clearer as we work through some examples; for now, play around with them, and make note of how each instruction manipulates the stack, registers, and memory.


Finding Main() - Compiler Code vs Developer Code

If you look at the code at the EP of test.exe and compare it with the source code in test.c, you'll notice that they look nothing alike. The code immediately after the EP has several function calls to APIs like __set_app_type and atexit. That is because when source code is compiled, the compiler adds some code to the beginning of the program in order to properly initialize the application before executing the code written by the programmer. Different compilers will do drastically different things, so you can usually identify what compiler was used as soon as you see the EP. This particular program was compiled with Dev-C++ which uses the GCC compiler; however, in the vast majority of cases, you don't care much about the compiler code - you want to see what the programmer wrote. So, let's see how we can identify when the switch from compiler code to developer code is made.

Press F8 a several times to single step through the first few instructions, and you will notice that after you execute the 'CALL test.00401100' instruction, the program runs normally. That is because the main program loop (or a call leading to the main program loop) is located at 0041100. Because we pressed F8 to execute the call instruction, Olly executed everything inside that call instruction, and because our program waits for user input before returning from the main loop, the call instruction has not completed yet. To remedy this, restart the program in Olly (Ctl+F2), press F8 until the next instruction to be executed is 'CALL test.00401100'; this time, press F7 to step into the instruction, and you will be at the first instruction of the function at 00401100:

2.png

Let's take a moment to examine this function before executing anything...calls to SetUnhandledExceptionFilter and __getmainargs? This still doesn't look like our main function, so the main function is probably called from inside of this one. Scroll down in the code window until you see this code:

CALL test.00401290

MOV EBX,EAX

CALL <JMP.&msvcrt._cexit>

MOV DWORD PTR SS:[ESP],EBX

CALL <JMP.&KERNEL32.ExitProcess

Notice there is a call to _cexit followed by a jump to ExitProcess. Well, if ExitProcess is being called, then the call to our main function has to occur before this. Most of the function calls are located in msvcrt.dll (the '&msvcrt' before the function name is a dead give away), but look at the call just before the call to _cexit ('CALL test.00401290'). It is referenced by a memory address rather than an API function name. Select the 'CALL test.00401290' instruction and press F2 to set a breakpoint on it. Now, press F9 to let the program run normally; when the code execution reaches the breakpoint the application will pause on it before executing the instruction. When 
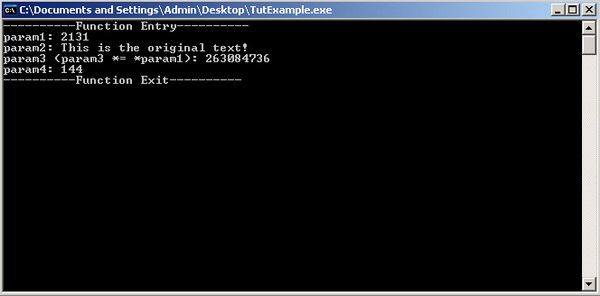
Olly breaks there, press F7 to step into the call. We are now at memory address 00401290, and the function here looks like our main loop - one call to printf(), followed by one call to getchar(), followed by a return:

3.png

In general, the compiler code will call the main loop just before a call to _cexit/ExitProcess, so looking for those two functions can help in finding the start of the main function. The Visual C++ compiler code is a bit more complicated, so we will take a look at how that differs from GCC, but first let's examine our main loop while we're here. There is a lot of data moving in and out of EAX just before the call to prinf(), so let's see if we can figure out what's going on.

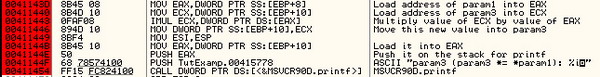
Press F8 until you arrive at the instruction 'MOV EAX, DWORD PTR DS:[403000]'. This instruction is moving the contents located at the memory address of 00403000 into the EAX register. The very next instruction moves the contents of EAX into a local variable on the stack starting 28 bytes below EBP. Well, let's see what is located at 00403000: select the memory dump window in the lower left hand side and press 'Ctl+G'. Enter '403000' (no quotes) at in the text box and click OK. Starting at address 00403000, we see our text string that is displayed by the printf() function:

4.png

Since the EAX register can only hold four bytes at a time, only the first four bytes of our string have been copied into the local variable; the subsequent instructions move the rest of the string into the variable's address space four bytes at a time. Finally, the address of the local variable is loaded into EAX, and EAX and the "%s" string are placed on the stack as arguments to the printf() function.

Why did the program go through all the trouble of copying the string in four byte increments onto the stack, when it could have just referenced the original memory address where the string was located (00403000)? Well, because we told it to. In the source code, test.c, you can see that we declared a variable named 'string', and set it equal to the string we wanted passed to printf(). Since a 32-bit processor can only move 32 bits at a time, it had to copy the string from the data section of memory into the string variable four bytes at a time. If we had made the string variable a pointer, the program would have only needed to copy the 4 byte memory address of where the string was located into the variable (the pointer would then point to address 00403000). This would have required only two mov instructions rather than sixteen; it also would have eliminated the need for the LEA instruction. That's almost a 200% decrease in the number of instructions contained in our main function. Granted, this is a very simple program and CPUs are very fast these days, so no measurable difference is seen by the end user. But it is a good example of how disassembly can be used to further our knowledge of high-level programming and help us to develop more efficient applications.

I mentioned earlier that different compilers will produce different assembly instructions for the same source code. Since VC++ is the most commonly used compiler for Windows applications, I've compiled the code in test.c using VC++, and saved it as test_vc.exe. Opening test_vc.exe in Olly reveals a vastly different set of assembly instructions that we saw in test.exe:

5.png

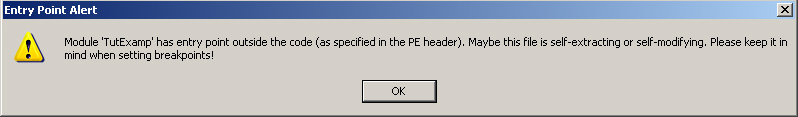
You may have been wondering why you received a warning message from Olly that test_vc.exe had an entry point outside of the code section. Without delving too much into the subject of PE (Portable Executable) headers, each Windows program has a PE header which, among other things, identifies which sections of the program contain the code, which sections contain data, etc.

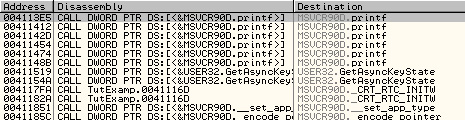
Here, we see that our EP is actually a jump to 00411840, but before we go there, let's take a look at the surrounding jumps. There are a lot of jumps to a lot of different functions, including printf()...right-click the code window and select 'Search for -> All intermodular calls'. This brings up a window that shows all of the function calls in test_vc.exe that are external to the program (i.e., API functions). Comparing the list of functions here with the list of jumps in the code window, we see that there is a jump for nearly every inter-modular function, as well as several functions that are listed only by address (these are internal to the program). The way this works is, whenever a function call is made within the program, instead of calling the memory address where the actual function is located, it calls the memory address where the jump to the function is located. For example, the jump to printf() is located at 0041118B, so wherever there is a call to printf() within the program, it will actually call 0041118B, which in turn jumps to the actual location of the printf() function. The advantage of this is that if you have a function that is called from multiple locations in your code, and the memory address of that function changes, you only have to change where the jump points to, rather than every single call to that function. It should be noted that depending on compiler options that have been set, the EP code may differ, and in fact, you will normally not see an EP that looks like this when debugging a real-world application; however, this was compiled using the default settings for VC++ 2005.

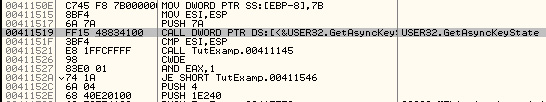
Press F8 to jump to the first function; this is a very short function which calls two functions then returns, so our main function must be somewhere inside one of those function calls:

PUSH EBP

MOV EBP,ESP

CALL test_vc.00411050

CALL test_vc.00411860

POP EBP

RETN

Press F8 until you reach the first function call, then press F7 to step into it. Notice that we are back at the jump table, and that the actual function is located at 00412AB0:

6.png

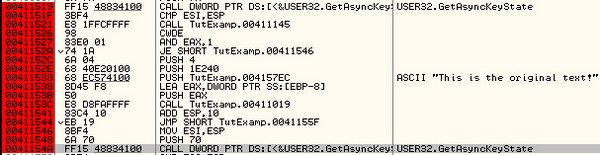
Press F8 again to follow the jump to the actual function. Here we see a lot of calls to functions like GetCurrentProcessID and GetCurrentThreadID, but no calls to any exit functions. The call to the main function is probably not located here, so press F8 until you return from this function, and you will be sitting at the second call which points to 00411860. As before, press F7 to step into it, and notice that it does not take us to the jump table, but rather directly to the function itself. Scrolling down in the function code, we see a call to exit(), and a few instructions above that a call to an internal function located at 00411136:

7.png

Set a breakpoint on the function call to 00411136 and press F9 to run the program. When it breaks, press F7 to step into the call; this again takes us to the jump table, so press F8 to get to the start of the function:

8.png

Now that looks more like it! There is a reference to our string (or at least part of it), and calls to printf() and getchar(). But getting here was kind of a pain, and there's an easier way. Notice how the call to the main function was made just before calls to exit() and _cexit(), and in the previous program that was compiled with GCC, the call to the main function was located just before a call to _cexit()? And remember how we were able to view all of the inter-modular calls? Well, right click the code window and again select 'Search for -> All intermodular calls':

9.png

Hmmm, there are two calls to _cexit() and one to exit(). Double click on the first call to _cexit() and Olly will take you to back to the code window and you will be located at 004118F6, which obviously is a call to _cexit(). Scroll up just a few instructions and there is the call to our main function located at 00411A01.


EXE Patching

One of the great functions of a decent debugger is that it allows you to modify instructions and data, and Olly is no exception. patchme.exe is a simple program that prints the text "This is the wrong text!" to the screen, and is very similar to the test.exe program we worked with earlier. The only differences are that no source code is supplied for patchme.exe, and the object of this program is to make it print "This is the right text!". Depending on how the program was coded, there may be several different ways to accomplish this, so let's open it up with Olly and see what we can find.

Once opened in Olly, find the main function for patchme.exe; it should look like this:

10.png

As we've seen previously, everything through the two function calls at 004012B0 and 004012B5 is generated by the compiler; the real code starts at 004012BA, where zero is moved into a local variable (we'll call it var1). Next, the memory address 0040301A is moved into another local variable, var2. In the memory dump window, go to the address 0040301A and you will see that it is our "This is the wrong text!" string; so we know that var1 is set equal to zero, and var2 is a pointer to the text string. Next, var1 is compared to 1, and if they are not equal (which we know they aren't), the program jumps down to 004012E5, where var2 is pushed onto the stack and printf() is called.

But look, there are two calls to printf(); because var1 didn't equal 1, the first one was skipped. Looking at the next instruction after the conditional jump (JNZ), we see that the memory address DS:[00402000] is placed into EAX, and then EAX is placed on the stack as an argument to printf(). To find out what is located at DS:[00402000], set a breakpoint on 004012BA (where var1 is set equal to zero), restart the application and press F9 to run it. When Olly breaks at 004012BA, press the space bar to change the assembly code:

11.png

Change the 0 to a 1, click 'Assemble' and then 'Cancel' to close the window. Now that we have changed the code to set var1 equal to 1, F8 through the next few instructions and notice that this time, the jump to 004012E5 is not taken. When you get to the 'MOV EAX,DWORD PTR DS:[402000]' instruction, notice that the information bar below the code window indicates that DS:[00402000] is the address 00403000. Take a look at this address in the memory dump window:

12.png

Well how about that...the string we want to print ("This is the right text!") is located there, just above the "wrong text" string. So, if var1 is set equal to 1, then the "right text" string is printed...to test this, press F9:

13.png

Bingo! Now if we want to permanently patch the program, all we have to do is go back into Olly, right-click the code window, select 'Copy to executable -> All modifications' and click the 'Copy All' button when prompted. Right click inside of the new window that appears and select 'Save File'. Save it as patched.exe, exit Olly, and run the new program - you'll be greeted with the "right text" string.


Intro to Keygens and Un-packing 

Writing  Key Generators

Why write a keygen? Because while patching a file is useful, you don't learn nearly as much about reverse engineering than you do when writing a key generator. In many cases it is not desirable to permanently patch an executable, so it is necessary to completely reverse a function or algorithm; writing key generators is good practice in performing in-depth code analysis.

For this part of the tutorial, we will be examining KeygenMe3 by Tanatos, and ArealApp.exe (both included in the apps directory). In KeygenMe3, we will learn how to un-pack a compressed executable, do some serial fishing, and trick the program into becoming its own key generator.

ARealApp is a "keygen-me" program which uses a key generation algorithm that I reversed from a real-world shareware application. For legal purposes I did not want to identify the shareware program, so I wrote ARealApp using the exact same algorithm used in the shareware executable. Here we will completely reverse engineer the algorithm used for key validation, and write our own keygen in C.

Executable Compression & Dumping

Let's focus first on KeygenMe3 first; open it up in Olly, click through any warning messages, and take a look at what we have:

14.png

As we saw in part one of this tutorial, most functions begin with a prelude which manipulates the EBP and ESP values accordingly; this program starts out with the PUSHAD instruction which pushes the contents of all the registers onto the stack. This is a sure sign of a packer, usually UPX or ASPack (opening the executable with PEiD does in fact identify this program as being packed with UPX). If you are unfamiliar with packers, they simply compress the executable file so that it takes up less space on the disk, and add a de-compression routine to the beginning of the executable in order to un-compress the program when it is loaded into memory. The basic layout of most of these simple routines is:

PUSHAD

/*de-compression routine here*/

POPAD

JMP OEP

We want to find the jump to the OEP (Original EP) so that we can view the original assembly code; since this jump is made only after the executable code has been decompressed, we will have no trouble viewing it. We could trace through the de-compression routine, but there's an easier way. Notice that the first instruction is PUSHAD (which saves all the register values onto the stack), and the last instruction before jumping to the OEP is POPAD (which restores the previously saved data from the stack to the registers). The routine does this to ensure that the register values will be set up properly for the program; in other words, it doesn't want the original code to have any idea that extra code has been run before arriving at the OEP, because the instructions there are expecting certain values, and wouldn't know how to handle any errors that might result from variations in the register values. This means that the only instruction that will touch the values placed on the stack by PUSHAD is the final POPAD instruction. If we place a hardware breakpoint on those values after they have been pushed, then the next time they are accessed (which will be by the POPAD instruction), we will be sitting at the JMP OEP instruction.

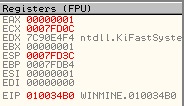
Press F8 to execute the PUSHAD instruction; notice how the value of ESP changes to reflect the fact that new data has been pushed onto the stack:

15.png

Right-click the ESP value, and select "Follow in Dump". The memory dump window now shows the values at that address:

16.png

The first four bytes are the same bytes located in the EDI register, since it was the last register to be pushed onto the stack by the PUSHAD instruction. Note also that each byte of each register has been pushed in reverse order. Now, select those first four bytes in the dump window, right click and select "Breakpoint -> Hardware, on access -> Word". Press F9 and Olly will break right after those four bytes are accessed by the POPAD instruction:

17.png

Press F8 to execute the JMP instruction (this is the jump to the OEP that we were looking for!), and the code should look much more friendly now:

18.png

Now that we have let the program un-compress itself, we will save it in its un-compressed state. The easiest way to do this is with the OllyDump plugin. Right click the code window and select "Dump debugged process". In the window that pops up, click 'Dump', and save the file as tknm3_dump.exe:

19.png

Olly will correct the entry point address, import function addresses, and anything else that needs to be fixed; run tknm3_dump.exe, and it should run normally.

If you are not planning on permanently modifying a program, it is not necessary to actually save it in its de-compressed form. However, since we will need to make modifications to this executable, this final step was required.

Self-Keygens

Self key generation is the act of patching the target application in such a way that it reveals the correct serial key to the end user. This is most often done by finding the memory address that the calculated correct key is stored at, and replacing the text in the standard "Incorrect serial number" message box with the correct serial number. And that is exactly what we will be doing with tknm3_dump.exe.

But I'm getting ahead of myself. Let's assume that we know nothing of this program (other than the original executable was packed with UPX of course); the first thing we should do is open it up in Olly and run it! 
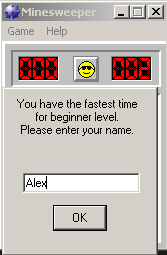
We have a dialog box asking for our name and registration key:

20.png

Clicking the 'Check' button without entering any information results in a message box telling us to enter a name that is at least three characters long; this is interesting, because it means that the serial is probably generated based on the name entered. So, put in a three character name (I used 'aaa') and click the 'Check' button again. What's this? We get the same error message. In fact, we have to enter a name that is at least four characters long in order to pass this first check - obviously a programming error, and it is always good to note such errors as they may come in useful while disassembling the code (in this case, it doesn't however).

Now that we've entered a valid name, we get another message box telling use we forgot to enter a serial number. So, put in something random like '12345' and click 'Check' again. We now get a "Wrong serial! Try again" message. Now, this message box is obviously the negative result of running our entered serial number through the serial validation algorithm, so if we can find where this message box was called from we can trace back from there and find the algorithm and/or comparison in 
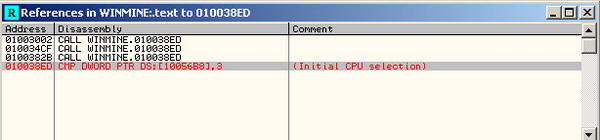
question. In Olly, press F12 to pause the program, then press Alt+K to view the call stack. Here we see recently called functions, among them, two calls to MessageBox:

21.png

The second one, called from 00401172, is the one we are looking for. We know this because anything with very high memory addresses, like 77D8054B, is usually located in a DLL file, and the second message box was called from a memory address that resides inside the target program's memory range. So back in the code window of Olly, press Ctl+G and go to address 00401172:

22.png

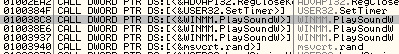
Interesting, no? A few instructions above the address in question, we see there is a call to GetDlgItemTextA, followed by a call to 0040120D. The return value of 0040120D is compared using a TEST operation, and if EAX is zero, the serial error information is pushed to the message box function; if it is not zero, then the "Registered" text is pushed to the message box function. The function at 0040120D definitely warrants some more investigation, but let's look at a few more things first. If you scroll up a little further, you'll see that our entered serial number is stored at 0040B420, our entered name is located in 0040B1E0, and there is an unknown number (it will be '3825205248' if you have used the name 'aaaa') stored in 0040B300. Now, let's set a breakpoint (F2) at the first argument that is supplied to the GetDlgItemTextA call ('PUSH 32' located at 0040112F), and restart the program in Olly.

Run the program again, supplying the same name and registration key, and click 'Check'. The first item that is pushed is the number 0x32 - this is the maximum size of the string, so we know that our serial can't be more than 50 characters long. The next item that is pushed is the address to store the string in, and you can see that this value is indeed  0040B420, where we found our serial number stored the last time. The other two values are the control ID and dialog box handle, neither of which are important for our purposes. Step through the code until the call to GetDlgItemTextA has been executed. The next three instructions are important: there are two values pushed onto the stack, and then a call to the mysterious function located at 0040120D. Looking at the two values that are pushed, the first is 0040B300 (remember that "strange" string we saw earlier?) and 0040B420, which is the address where our entered registration key is located. Press F7 to trace into the function call.

This is a small function, consisting of a single loop:

23.png

First, the unknown string address is moved into EDX, while the address of our serial number is moved into ECX. The value of ESI is pushed onto the stack, and ESI is then set to 1. EDX+1 is then loaded into the EAX register; this is interesting because it means that the first character of the unknown string will NOT be examined. Then, the SECOND byte of our registration key is moved into DL (again, the first character is ignored), and DL and the first character of the unknown string are compared. If they do not match, then the function jumps down to 00401231 where EAX is set to zero, the original value of ESI is restored, and the function returns. However, if they do match, then ESI is incremented, EAX is incremented, and if ESI is not greater than 4, then the function loops back to 0040121E where the next two bytes in each of the strings are are compared with each other. If ESI is greater than 4, then EAX is set to 1, ESI is restored, and the function returns.

If that seemed a little confusing, don't worry, it's just my lack of communication skills; the function is quite simple actually. The relevant pseudo code looks like this:

//EDX points to the unknown string

EDX = *unknown_string

//ECX points to the serial number we entered

ECX = *entered_serial

//ESI is initialized to one

ESI = 1

//EAX points to EDX+1, aka, the unknown string starting at the SECOND byte

EAX = EDX+1

/*this next instruction is just some math to make it easier to reference the unknown_string and the entered_serial...the unknown string is at the memory address stored in EAX, and the entered_serial is at EAX+ECX. Also, since EAX actually points to the second byte of unknown_string, EAC+ECX actually points to the second byte in entered_serial as well. */

ECX = difference between ECX and EDX

//loop four times

while ESI <=  4

            //do the bytes in unkown_string and entered_serial match?

            if (ECX+EAX) == EAX

                        //increase ESI for loop purposes

                        ESI++

                        //increase EAX, aka, look at the next byte in each string

                        EAX++

            else

                        //if they don't match, set return value to 0 and return

                        EAX = 0

                        return

            end

end

//if we've gotten here, then all comparisons were successful, so set return value to 1 and return

EAX = 1

return

To recap, we know the following:

  1. If the return value of  0040120D is 0, then we get the bad serial message; else, we get a good serial message.
  2. 0040120D compares our entered serial with a string that is located at  0040B300.
  3. 0040120D ignores the first byte of both our serial number and the string at  0040B300.
  4. Only bytes 2-5 in each string are compared (the loop only runs four times).

So, we can conclude that the valid serial number is located at 0040B300, but only bytes 2-5 are relevant. So, a valid serial has to be at least 5 bytes long; the first byte can be anything we want, but the next four must match with the respective bytes in the string at 0040B300. Note the string value at 0040B300 (I used a name of 'aaaa', so my value is '3825205248'). Restart the program, enter the same name, and for the registration key enter the first five numbers of previously noted value, replacing the first number with whatever you like (in my case I entered '08252'):

24.png

Bingo! Now we just need to patch a few instructions in order to turn this program into a handy little key generator for itself.

We know that the registration key is located at 0040B300, so all we have to do is change the memory address pushed to the MessageBox function from 0040A0A4 ("Wrong serial! Try again") to 0040B300 (the correct serial number):

25.png

This way, when an incorrect serial number is entered, you will get a message box that shows you the correct serial number:

26.png

Save your changes to the executable and the keygen is done!


Reversing Key Generation Algorithms - Writing a Real Key Generator

Some people consider the previous keygen project cheating because we didn't actually reverse the key generation algorithm. If our only object was to create a keygen then this is fine, but from a purely RE perspective, they are right. So in this next installment, we will be completely reversing a registration key validation algorithm, and writing a key generator in C. The target application, USP.exe, has been written in C and uses a key-validation algorithm found in the wild (i.e., this was used in an actual shareware program). I have included the source code for both USP and the USP keygen, but don't peek at them until we've disassembled the binaries...that would take all the fun out of it.

First, let's run the USP to see what we have (yes, I was lazy and made it a CLI program). We see it prompts for a user name and a registration key...let's enter some fake credentials, say, 'test' for our name and '12345' for our key. We receive an "Invalid Registration Key!" message - not entirely unexpected. Now let's open USP up in Olly and see if we can find the code that accepts the user name and password, then subsequently validates (or in our case, invalidates) them. Since this is a simple program, we'll start by finding the main function, since there probably aren't too many nested functions we'll have to follow to find what we're looking for. In a real-world application we would probably have to use the trick we learned earlier of pausing the program then examining the call stack to find the section of code we are interested in. We find the main function at 00401380:

27.png

Note that the main function uses printf() and gets() to prompt for and retrieve the user name and registration key. Also of note is the function immediately above the main function (at 0040135D) which prints the "Invalid Registration Key!" text, then exits; this is our "bad" function. The gets() function takes one argument: the address to store the retrieved text into. Examining the above code shows that the user name we enter is stored at 004040D0, and the registration key at 004040B0. Strlen() is then called to determine the length of the registration key we entered (we know this, because the address where the registraiton key is stored is passed to the strlen() function), and the value returned is compared to 0x17 (23 in decimal notation). If the value in EAX is equal to 0x17, then a jump to 004013FC is made, but if not, then the function at  0040135D (the "bad" function!) is called. This tells us the first piece of information we need to know about the registration key; it must be exactly 23 characters in length.

The purpose of the rest of the code may not be so obvious when viewed in a dead listing, so let's see what happens when we enter a key of 23 characters in length. Set a breakpoint on 004013FC since we should land here if our key is the correct length, and run the program. Enter some fake credentials again, ensuring that your key is 23 characters long (I used '12345678901234567890123'), and Olly will pause at our breakpoint:

28.png

Now, this is interesting; the code is moving one byte of data from the memory address 004040B5 into the EAX register, then comparing that byte to the byte stored at 00402025. Now, we know that the registration key we entered is stored at 004040B0, so these instructions are actually comparing the 6th byte of our registration key with some other byte at 00402025. Taking a look at the information window just below the code window confirms that the byte pointed to is in fact the 6th byte of our registration key:

29.png

The question is, what is this byte being compared to? Press F8 to execute the MOVZX instruction, and again we can use the information window to see what is stored at 00402025:

30.png

Our 6th byte gets compared to a hyphen, and the following JNZ instruction shows that if they are not equal, then a jump is taken to 004014F3, which happens to be a call to the "bad" function at 0040135D. So we know that our 6th byte must be a hyphen - but look, this same comparison is performed on bytes 004040BB (the 12th byte in our registration string) and 004040C1 (the 18th byte in our registration string). This tells us that every 6th character in the string must be a hyphen. The registration key format now looks like:

12345-12345-12345-12345

Let's restart the program in Olly and enter in our new registration key ('12345-12345-12345-12345') so that we can pass this validation check as well, and we see that we do. Now we find our selves at 00401435, where two local variables, EBP-C and EBP-4 are set equal to zero before entering a loop which also contains a nested loop:

31.png

As you can see, I've added some comments in Olly (this can be done by pressing the semicolon key). We have three local variables here, all integers: var1 and var2 are used to count the number of iterations performed by the primary and nested loops respectively; var3 is incremented each time the nested loop is executed, and based upon the value of var3, the function at 00401290 is called with different arguments. Note that var3 is also incremented each time the primary loop is executed, but only after the if statements.

We can also see that the primary loop is executed 23 times, and the nested loop is executed 5 times and is doing something with the registration key we entered. This is particularly interesting, because we know that a valid registration key is 23 characters long, and that it consists of four sets of 5-character strings, each set being separated by a hyphen. We can assume then, that these loops are either performing some type of calculations on the key as a whole, or on each of the four hyphen-separated strings that compose the key, or both.

To get a better idea of what is going on, let's start single-stepping through the code and see if we can determine what type of calculations it is performing. The first few instructions in the primary loop serve only to check if var1 is greater than 22 and to set var2 equal to zero. The nested loop is rather interesting however; here is another screenshot where I have added some more notes regarding the nested loop:

32.png

There doesn't seem to be any data located at 00404090 (yet), but we know that the registration key we entered is stored at 004040B0. We also know that var2 and var3 are initialized to zero, and incremented each time the nested loop executes, and that the nested loop loops five times. Here is some pseudo code to help clear things up:

var2 = 0;

5.times do

            //move one byte from our registration key into a variable located at 00404090

            00404090[var2] = 004040B0[var3];

            //increment var2 and var3 so that the above instruction will point to the next byte in each string

            var2++;

            var3++;

end

So, the first time the nested loop executes, it places the first five characters (i.e., the first of the hyphen-separated sets) of our registration key into a variable at 00404090. Each time this loop is called var2 is set to zero, so the values stored in 00404090 from the previous loop iteration will be overwritten each time the loop is called. Remember that we previously noted how var3 was also incremented once after the nested loop finishes executing? That is because the program wants to skip the hyphens in our registration string. For example, let's say that our registration key is '12345-67890-ABCDE-FGHIJ'. The first time the nested loop executes, it will copy '12345' into the variable at 00404090, the second time it is called, it will copy '67890' into 00404090, etc.

It appears that the program examines each 5-character set in our registration key individually, so let's try and find out what it does with them. The rest of the primary loop consists of if statements, comparing the value of var3 (which indicates how many characters of our registration key have been copied into 00404090) to several hard-coded values:

33.png

Again, let's create some pseudo code to help understand what is going on:

if var3 == 5

func_at_00401290(43,string_at_00404090);

else if var3 == 11

func_at_00401290(23,string_at_00404090);

else if var3 == 17

func_at_00401290(17,string_at_00404090);

else

func_at_00401290(53,string_at_00404090);

endif

var3++;

var1++;

For each if statement, the function located at 00401290 is called, and takes two parameters: an integer value, and the address of the variable that contains one of the hyphen-separated strings that make up our registration key. However, depending on which of those hyphen-separated strings is currently located at 00404090, a different integer value is passed to the function at 00401290. For the first string set, the value 43 is pass; for the second, 23, the third, 17, and for the fourth and final set , 53.

Once this primary loop is complete, the code immediately prints the "Thank you for registering" message; but, we know that we do not get that message when we enter an invalid registration key, so something is happening in the function at 00401290 that prevents the loop from completing. Put a breakpoint on the first call to 00401290 and press F9. When Olly breaks, take a quick look at the stack values that have been pushed; you will see the value 0x2B, and the memory address 00404090, which contains the first five characters of our registration key (from here out this will be simply called "the string"). Press F7 to step into the function call:

34.png

Again I have added some notes in Olly to help follow the assembly code, however, the first thing I want to look at is the ASCII string located at 00402000:

"2YOPB3AQCVUXMNRS97WE0IZD4KLFGHJ8165T"

If you notice, this string is 36 bytes long and contains all of the alpha-numeric characters. If you examine the code in Olly, you see that we have a primary loop with a nested loop, very similar to the previous loops we examined. In fact, the loops themselves function almost identically as the previous loops, so the loop structure should be familiar enough for you to figure out on your own. I have labeled six global variables which are used throughout the loop (gvar1-6); gvar2 and gvar3 are used to count loop iterations for the primary and nested loops respectively. If you skip the examination of the loops temporarily, you will see that gvar6 must be evenly divisible by the numerical value passed to the function. This is why we never completed the previous loop: if gvar6 is not evenly divisible, then it calls our "bad" function, which prints the "Invalid registration key" text and immediately exits the program. The trick now is to find out how gvar6 is calculated.

The primary loop's only function here is to loop five times, once for each character in the string that has been passed to the function; the inner loop loops 36 times (recall how the ASCII string of alpha-numeric characters is 36 bytes long?). So we already have a pretty good idea that each character in "the string" is compared to each character in the ASCII string: this is done using the CMP instruction at 004012E2. If the characters are not equal, then the program simply jumps down to 00401236, increments gvar3 (the inner loop counter), then runs the next iteration of the loop. However, if they are equal, the values in gvar1 (which is initialized to zero before the loops) and gvar3 (the number of times the nested loop has run, aka, the position of the character in the ASCII string that matches the character in "the string") are added together, and the sum saved in gvar4. Next, gvar1 is multiplied by 8, then added to itself (i.e., gvar1+gvar1*8) and the result stored in gvar5. Finally, gvar5 is multiplied by 4 and added to gvar4; the result is saved in gvar6. Now we know how gvar6 is calculated, but there is one more detail; after gvar6 has been calculated, gvar1 is set equal to gvar6. This means that subsequent loops will be affected, because gvar6 is not re-set to zero before other characters in "the string" are calculated. In other words, if "the string" was '44444', the resulting gvar6 value for each character in "the string" will be different because one of the variables used to calculate gvar6 (gvar1 to be precise) changes each time there is a match between the character in "the string" and a character in the ASCII string.

All of this is much easier to comprehend if you single-step through the code in Olly and examine the above notes I have taken on each instruction. However, to further simplify, here's some pseudo-C code:

int key_check_function(int divisor, char the_string[])

{

//initialize gvar1 to zero

gvar1 = 0;

                        //the primary loop which iterates through each character in the_string

                        for(gvar2=0;gvar2<5;gvar2++){

                                    //nested loop that compares the current character in the_string to every character in ascii_string

                                    for(gvar3=0;gvar3<36;gvar3++){

                                                if(the_string[gvar2] == ascii_string[gvar3]){

                                                            //if the two bytes match, calculate gvar6 for that particular byte

                                                            gvar4 = gvar1+gvar3;

                                                            gvar5 = gvar1+gvar1*8;

                                                            gvar6 = gvar4+gvar5*4;

                                                            gvar1 = gvar6;

                                                }

                                    }

                        }

                        //the final gvar6 value is divided by the divisor integer passed to the function

                        mod = gvar6 % divisor;

                        //if gvar6 is not evenly divisible, then call the "bad" function; else, return 0

                        if(mod != 0) {

                                    bad_function();

                        }

            return 0;

That's a bit much, so if you're still struggling with understanding how it all fits together, don't worry (I didn't get it right away either ;)...just step through the code in Olly some more, observe what is happening with the various values, and refer back to my Olly notes and/or the above pseudo code until you do.

Get it? Good, because now we are going to write a keygen for this. Unfortunately the mathematical force is not strong with me, so I couldn't figure out a way to create a reverse algorithm for this function; the problem of course is that you have to choose a value that is divisible by the particular divisor (remember how the key_check_function is called with different values for the divisor each time), then work backwards from there. It just seemed like way to much work...so instead, I wrote a keygen that brute forces each of the four 5-character sets in the registration key (remember that they are examined individually too). To do this, I generated a random set of four alpha-numeric characters, then iterated through each character in the ASCII string, checking to see if it would create a valid key set if plugged in as the fifth character. If so, then that value was used; if not, then another four character string was calculated, and the process was done over again. The resulting code is listed in the usp_key_gen.c file in the source directory.


Discovering and Exploiting Buffer Overflows

Now that we have sufficient practice in reversing closed source programs, it's time to examine buffer overflows. For this final section of the tutorial, we will be exploiting weird.exe which is a crack-me program included with Security Warrior. This program, as well as others used in the book, is available for download from O'Reilly Publishing (it is also included in the apps directory in this tutorial's zipped file). It is assumed that you have a basic knowledge of buffer overflows and stack operations.

Examining the Program

As usual, before doing anything else, let's run weird.exe and see what we are working with. We are prompted for a serial number, so enter whatever you like (I used the usual '12345'), and hit enter. We are taken to a new line and nothing else happens. Hit enter again and the program quits. Well, we didn't get much information to work with there, so let's take a look at it in Olly. Looking around in the code a bit, we find the function that prompts us for our serial located at 00401108:

35.png

We see that there are several references to ASCII strings...the first three we saw when running the program, but the fourth string reference (located at 00401177) looks like what we want to see when we enter a serial. Notice that it is pushed as an argument to the function at 00404B38, which is also the function used to print the first three strings to the screen - essentially the equivalent of printf(). Furthur, we see that the function at 0040479C is called immediately after prompting for our serial, so we can assume that this function is similar to gets(). However, examining the code that is executed between the call to 0040479C and the "w00! congrats" string reference, we see that there are no jumps to 00401177. In fact, all of the jumps explicitly jump over that string reference and the subsequent call to 00404B38. This means that even if we did enter a valid serial, we would never actually validate. So it looks like we'll have to find a way to take over the EIP and redirect the program's execution to the line at 00401177.

Some Quick BOF Information

For those already familiar with buffer overflows, skip to the next part of this section. As a quick refresher for everyone else, here are some basic rules about buffer overflows:

  1. The primary goal is to manipulate the value stored in the instruction pointer (EIP). Depending on the position and usage of variables in the program, there may be other ways to exploit a buffer overflow, but this is the holy grail.
  2. The EIP register can not be directly manipulated. For example, you can't do something like 'pop eip', or 'mov eip,eax'. However, when a function is called, the function must know how to return to the code that called it. This is done by automatically pushing a return address (the next instruction to be executed) onto the stack whenever a function is called. When the called function returns (the RETN instruction), it automatically pops the return address off the stack and into the EIP register.
  3. The above is the basis of your standard stack-based buffer overflow; when user-supplied data is copied into a location on the stack without any bounds checking, we may be able to supply a sufficiently long string of data that will overwrite the return value that was pushed onto the stack when the function was called. When the function returns, it will return to whatever memory address we overwrote the original return value with.
  4. To accomplish this, remember how data is pushed onto the stack. As data is pushed onto the stack, the stack grows downwards, from high memory addresses to low memory addresses. However, space is allocated for local variables on the stack as well, and when those variables are filled with data, the data grows UP. Suppose we have a function that defines three local char variables (one byte each):

char a,b,c;

For example purposes, the program will allocate three bytes on the stack for these variables, and the stack will look like this:

Return address  (4 bytes)

Saved EBP         (4 bytes)

char a               (1 byte)

char b               (1 byte)

char c                (1 byte)

Now, if we write one byte to char c, then the byte allocated for the c variable will be filled. But if we try to write two bytes to c, then the c variable will get the first byte, and the second byte will overflow into char b's memory address. If we write three bytes, the third byte will overflow into char a's memory address. If we write seven bytes into c, then we will fill the four bytes that contain the saved EBP value; if we write 11 bytes into c, then we will also fill the four bytes that contain the return address. So you can see that while the stack grows down, data written to the stack grows up.

Locating a Buffer Overflow

Before we can try to exploit a buffer overflow, we must first find one. We can start by looking for obvious vulnerabilities, such as the use of gets(), strcpy() and the like; this can be done by right clicking the code window in Olly and selecting 'Search for -> All intermodular calls'. This reveals some known calls, but nothing like what we are looking for; judging from the fact that proprietary functions have been used in place of printf() and gets(), the programmer has probably done this throughout the application.

Now let's examine avenues of attack; in other words, what data do we control? The only data that we control in this program is the serial number, so let's take a look at what is done with that serial number after we hit the enter key. We have already identified that the function at  0040479C retrieves the text that we enter, so let's breakpoint on that and step into it when Olly breaks:

36.png

As usual, I've included some notes. This function takes one argument, which is a memory address (the argument is located at EBP+8). The address of the argument is loaded into EBX; then the program jumps down to 004047C6, where another function at 0040408A4 is called; it is supplied with the memory address 0040D19C. This is the actual function that retrieves our registration text, and it places it in 0040D19C. But, we needn't examine this function, because there is something interesting happening immediately in the current function code. Note how the loop starts copying the retrieved text one byte at a time onto the stack? While the function at 0040408A4 placed the string in a memory address, this loop is copying it into the address that was passed to the function as its one and only argument. Taking a look at the stack, we see that the address that our string is being copied into is 0012FF40, and the return address for this function (ideally the one we want to overwrite) is located at 0012FF38:

37.png

As you step through the loop however, you will notice that the string text is growing away from the return address at 0012FF38. Why? Recall that the stack grows down, but data grows up...the function was given an argument that contained the memory address to copy the string into, but that memory address (0012FF40) is located above the return address of the current function. However, not all is lost; the stack also contains return addresses for other functions, and these are located above 0012FF40. Let's trace through this current function until we return. We are now back in the first function that we examined. Let's trace through until the end of that function, and stop when we get to the RETN instruction at 0040118C. Take a look at the stack window:

38.png

Located at 0012FF90 is the return address for this function. We need the return address to read 00401177 in order for the program to jump back up to the instructions that print the "w00!" text. Some quick math tells us that 0012FF90 is 80 bytes above 0012FF40, where our registration text begins to be copied into. So, the 81st byte would overwrite the first byte of the saved return address, the 82nd would overwrite the second byte, and the 83rd would overwrite the third, etc. We can test this by supplying 84 bytes of text as a registration key:

39.png

Now let's look at the stack when we reach the RETN instruction for the first function:

40.png

0x41 is the hex value for the ASCII letter 'A' - now that we know we can control the EIP through this return instruction, it's time to code an exploit.

We don't want the function to return to 0x41414141, we want it to return to 0x00401177, so the last four bytes will need to be changed so that when they overwrite the saved return address with this value. For this, we will write a simple perl script:

#print 'A' 80 times to fill up the space between 0012FF40 and 0012FF90

print "A"x80;

#print the last three bytes of our desired return address in little-endian order

print "\x77\x11\x40";

What's going on with that last line you ask? Why are there only three bytes, and why are they in reverse order? The x86 architecture uses what is called little-endian byte order; in other words, data is written to the least-significant bytes first. So, as the loop writes each byte of our string into the stack, the data is written in this order (assume that the string 'ABCD' has been entered):

00000000         No bytes copied

00000041         First byte (A) copied

00004241         Second byte (B) copied

00434241         Third byte (C) copied

44434241         Fourth byte (D) copied

As you can see, 'A', the first byte in our string, is copied into the lowest byte in the buffer. The second byte, 'B' is copied into the second-lowest byte, and so on. So, in order for our return address to read '00401177', we need to enter a string that supplies 0x77 first, 0x11 second, and 0x40 third. Which brings us to our second question, why are we ignoring the highest-order byte, 0x00? Well, all text strings in a program must be null terminated (i.e., they must end with 0x00); user-supplied strings are no different, so when you supply your registration key, the 0x00 is automatically added on to the end of the string for us!

OK, now, the test. Run the perl program:

41.png

And copy/paste the output into the input of weird.exe. Press enter twice, and:

42.png

Whew!! That's a lot of information for a beginner. So let's let that sink in for a while, and we'd be more than happy to continue the conversation in the forums. Be sure to use that little cartoon bubble at the top of this article to get there.

Hope you're enjoying this continuing series on programming for the non-coding security professional. As always, send me your feedback on what we've already done as well as topics you'd like to see covered in future articles.

'Hacking' 카테고리의 다른 글

API & DLL  (1) 2009.01.24
W32DASM Disassembler  (0) 2009.01.24
Intro to Reverse Engineering - No Assembly Required  (0) 2009.01.24
ASProtect 1.23 RC4 - 1.3.08.24  (1) 2009.01.24
Gunz Original Files  (0) 2009.01.20
Posted by CEOinIRVINE
l
Intro to Reverse Engineering - No Assembly Required PDF E-mail

assembler.jpgLast time we went over the C programming language in an introductory article specifically focusing on getting the security professional on the road to coding (or at least the road to understanding). This time around we extend the series of coding articles for non-programmers with an area of high interest in the infosec community, reverse engineering.

This paper is intended as an introduction to reverse engineering for someone who has no experience whatsoever on the subject. You should have some basic knowledge of C programming, and access to a Windows or Linux box (preferably both) using the x86 architecture (i.e., your average computer). No knowledge of assembly code, registers, or the like is assumed, although it helps. The "Introduction" section of the paper is intended for the newcomer who has little or no understanding of what reverse engineering is and may be skipped by those looking for more technical details.

Active Image
Active Image del.icio.us

Discuss in Forums

Table of Contents

1) Introduction
    An introduction to reverse engineering and some basic RE concepts.

2) Assembly Basics
    Introduction to assembly programming language and process memory.

3) The Stack In Detail
    Detailed workings of stack operations.

4) Reverse Engineering a Program 
    Disassemble and reverse engineer two programs; one with the source code, one without.

 Introduction

What is Reverse Code Engineering?
"Reverse engineering (RE) is the process of discovering the technological principles of a mechanical application through analysis of its structure, function and operation"(Wikipedia).  Basically, Reverse Code Engineering (RCE) is the application of the reverse engineering process to software - in other words, analyzing a program in order to understand how it works. Because reverse engineering is most commonly used to analyze closed-source programs, it is largely focused on the Windows platform; however, reversing under Linux is also popular for inspecting buffer overflows, closed-source Linux applications, and hostile Windows programs (without the risk of running them).

Why Reverse Engineer?
There are many reasons to reverse engineer a program.  Have you ever wished that your favorite Windows program had xyz functionality? Want to dissect malware or viruses? Look for and analyze a buffer overflow? Figure out how that hardware driver works so you can write one for Linux? Maybe you're just curious how a particular program works, but you don't have access to the source code? All of these are common reasons for reverse engineering an application, and as such, there are many varied facets of RCE that one may choose to focus on, each of which can take a substantial amount of knowledge and experience to become an expert in. This paper will give you with the basic knowledge to get started in RCE, providing a base to launch into which ever specialties you prefer.


How Does It Work?
This all sounds great, but how do we analyze a program for which we have no code?  There are many ways to observe how a program interacts with the rest of your system, such as  file and registry access (which can be helpful when reverse engineering), but these techniques still leave you with a black box - you don't know what is going on under the hood. In order to understand how we can analyze the internal workings of a program, some understanding of the compilation process is needed. When you compile your source code, there are three major steps that occur: translation of the source code into assembly code, assembly, and linking.

First, the source code is translated into assembly code by the compiler. Assembly is a very low-level programming language; it is composed of many simple instructions which deal directly with memory addresses and CPU registers. For instance, if you assign the number 1 to an integer variable in your source code, the resulting assembly code may look something like:
 

mov 0xffffffb4,0x1

which moves the number 1 into 0xffffffb4, the memory address assigned to that particular variable. No matter what programming language you are using (C/C++, Delphi, VB, etc), all compiled languages must be first translated into assembly before being converted into the final binary program.

Next, an assembler translates the assembly code into machine-readable code; there is (usually) a one-to-one translation between the assembly and machine code. The final stage is performed by a linker, whose job it is to add in any library functions required by the program.  The final result is a file that contains binary instructions which can be executed by the processor.

The point of all this is that since all programs are translated into assembly code, and assembly code can be translated directly into binary 1s and 0s, we can translate any binary program back into its assembly code through the aptly named process of disassembly. If you understand assembly code, you can follow the instructions to understand what the program is doing, and even translate it into a higher-level language such as C. Note that some languages can be automatically translated directly back into their original source code, or decompiled. While this process works well for some languages, it is generally very complex and imprecise for most programming languages, particularly C/C++. I encourage you to look into some of the ongoing decompiler projects, however, this paper will be focused only on disassembly.

Opposition to RCE


It is important to realize that for various reasons, people may not want you to reverse engineer their programs, and as such, they may implement encryption or advanced protection techniques which make it extremely hard to analyze the original assembly code. We will certainly not be covering these techniques in this paper, but it is good to keep in mind if you come across a disassembled program that doesn't seem to make any sense.

A second issue is the legality of RCE. Many EULAs prohibit reverse engineering, but this still may not make it necessarily illegal; like many digital laws, it is still somewhat undefined. However, I will quote the following from Exploiting Software:
 

These agreements [EULAs] usually contain language that strictly prohibits reverse engineering.  However, these agreements may or may not hold up in court [Kaner and Pels, 1998].

The Uniform Computer Information Transactions Act (UCITA) poses strong restrictions on reverse engineering and may be used to help "click through" EULA's stand-up in court. Some states have adopted the UCITA (Maryland and Virginia as of this writing [February 2004]), which strongly affects your ability to reverse engineer legally.


Normally, there is no need to fear RE-restrictive laws, unless you plan to publicize your work. One exception would be cracking, or using reverse engineering to circumvent an application's registration scheme, which is very illegal. All programs we will be working with in this paper are original, so there is no question of legality; however, it is very important to keep this in mind if you begin work on someone else's programs.

What Do I Need?
 

In short, tools and knowledge. Obviously, you must be able to read assembly code, however, it is not enough to just understand assembly instructions. You must also know how assembly instructions interact with areas of memory (particularly the stack), and what the CPU registers are used for. Knowledge of the high-level programming language that the application was written in can be very helpful, although it is not necessary. You should also understand specific system functions for the OS platform you are dealing with (such as Linux syscalls or the Windows API).

There are many tools available to the reverse engineer, much of them designed for specific purposes. However, there are two indispensable tools: the disassembler and the debugger. As its name implies, a disassembler disassembles a program's binary 1s and 0s into readable assembly code. A debugger can disassemble the binary instructions as well, but also allows you to run the code inside of the debugger; this gives you the distinct advantage of being able to observe the effect each instruction in real time, and allows you to better understand the program flow. The most popular debugger for Linux is the GNU debugger (gdb), which is also available for Windows; however, there are other very powerful debuggers for the Windows platform as well, such as SoftIce and OllyDbg. We will be using gdb in both Linux and Windows later in this paper.

Assembly Basics

Assembly language is specific to a processor's architecture - for example, a SPARC processor will use a different set of assembly instructions than a CPU using the x86 architecture, which will differ from the assembly instructions used when programming a PIC microcontroller. Since the most common architecture is x86, that is the instruction set we will be dealing with here. Before delving into the actual assembly instructions however, let's take a look at the CPU registers and process memory.

CPU Registers

A processor takes data and instructions that are stored in memory and performs whatever calculations are required, then writes the output back into memory as applicable. However, the CPU needs a place to store the data it retrieves from memory while it calculates; this is where the registers come in. Registers are small segments of memory inside the CPU that are used for temporarily storing data; some have specific functions, others are just used for general data storage. In a 32-bit processor, each register can hold 32 bits of data; in a 64-bit processor, the registers can hold 64 bits of data. This paper will assume the classic 32-bit registers are being used, but even if you have a 64-bit CPU, as long as it is backwards compatible with 32-bit applications, all of the following information is still applicable.

There are many registers used by a processor, but we are concerned primarily with a group of registers called the general purpose registers. The general purpose registers are composed of:


EAX
EBX
ECX
EDX
ESI
EDI
ESP
EBP
EIP

The EAX register is called the accumulator, and is commonly used to hold the results of a calculation. If a function returns a value, this value will be placed in the EAX register so that the code that called the function can access the return value.

EBX is a pointer to the data segment, and ECX is normally used to count the number of iterations in a loop; EDX is used as an I/O pointer. It is important to note that while these are the suggested functions of the EAX, EBX, ECX and EDX registers, they are not restricted to these uses, with a few exceptions. For example, EAX can be used to hold data regardless of whether or not that data is the result of some calculation; however, if a function returns a value, that value will always be stored in the EAX register.

ESI and EDI are used to specify source and destination addresses respectively; they are most often used when copying strings from one memory address to another.


ESP is a stack register, called a stack pointer, that points to the top of the stack; EBP is also a stack register (called the base pointer), used to reference local variables and function arguments on the stack. The exact purpose and usage of the ESP and EBP registers will be clarified in the following sections.

EIP is the instruction pointer register - it controls program execution by pointing to the address of the next instruction to be executed. For example, if your program calls a function that is located at the address of 0x08ffff1d, the value stored in EIP will be changed to that address so that the CPU knows where to go in order to execute the first instruction of that function. Note that there is no way to directly control the value stored in EIP.


The 'E' at the beginning of each register name stands for Extended. When a register is referred to by its extended name, it indicates that all 32 bits of the register are being addressed.  An interesting thing about registers is that they can be broken down into smaller subsets of themselves; the first sixteen bits of each register can be referenced by simply removing the 'E' from the name. For instance, if you wanted to only manipulate the first sixteen bits of the EAX register, you would refer to it as the AX register. Additionally, registers AX through DX can be further broken down into two eight bit parts. So, if you wanted to manipulate only the first eight bits (bits 0-7) of the AX register, you would refer to the register as AL; if you wanted to manipulate the last eight bits (bits 8-15) of the AX register, you would refer to the register as AH ('L' standing for Low and 'H' standing for High).
 

Process Memory and the Stack

Often, a process will need to deal with more data than there are available registers. To remedy this, each process running in memory has what is referred to as a stack. The stack is simply an area of memory which the process uses to store data such as local variables, command line/function arguments, and return addresses. Before examining the stack in detail, let's take a look at how a process is generally arranged in memory:
 

High Memory Addresses (0xFFFFFFFF)
---------------------- <-----Bottom of the stack
|                     |
|                     |   |
|         Stack       |   | Stack grows down
|                     |   v
|                     |
|---------------------| <----Top of the stack (ESP points here)
|                     |
|                     |
|                     |
|                     |
|                     |
|---------------------|  <----Top of the heap
|                     |
|                     |    ^
|       Heap          |    | Heap grows up
|                     |    |
|                     |
|---------------------| <-----Bottom of the heap
|                     |
|    Instructions     |
|                     |
|                     |
-----------------------
Low Memory Addresses (0x00000000)


As you can see, there are three main sections of memory:

1. Stack Section - Where the stack is located, stores local variables and function arguments.

2. Data Section - Where the heap is located, stores static and dynamic variables.

3. Code Section - Where the actual program instructions are located.

The stack section starts at the high memory addresses and grows downwards, towards the lower memory addresses; conversely, the data section (heap) starts at the lower memory addresses and grows upwards, towards the high memory addresses. Therefore, the stack and the heap grow
towards each other as more variables are placed in each of those sections.

Essential Assembly Instructions

Instruction Example          Explanation
push push eax Pushes the value stored in EAX onto the stack
pop pop eax Pops a value off of the stack and stores it in EAX
call call 0x08ffff01 Calls a function located at 0x08ffff01
mov mov eax,0x1 Moves the value of 1 into the EAX register
sub sub eax,0x1 Subtracts 1 from the value in the EAX register
add add eax,0x1 Adds 1 to the value in the EAX register
inc inc eax Increases the value stored in EAX by one
dec dec eax Decreases the value stored in EAX by one
cmp cmp eax,edx Compare values in EAX and EDX; if equal set the zero flag* to 1
test test eax,edx Performs an AND operation on the values in EAX and EDX; if the result is zero, sets the zero flag to 1
jmp jmp 0x08ffff01 Jump to the instruction located at 0x08ffff01
jnz jnz 0x08ffff01 Jump if the zero flag is set to 1
jne jne 0x08ffff01 Jump to 0x08ffff01 if a comparison is not equal
and and eax,ebx Performs a bitwise AND operation on the values stored in EAX and EBX; the result is saved in EAX
or or eax,ebx Performs a bitwise OR operation on the values stored in EAX and EBX; the result is saved in EAX
xor xor eax,eax Performs a bitwise XOR operation on the values stored in EAX and EBX; the result is saved in EAX
leave leave Remove data from the stack before returning
ret ret Return to a parent function
nop nop No operation (a 'do nothing' instruction)

*The zero flag (ZF) is a 1 bit indicator which records the result of a cmp or test instruction

Each instruction performs one specific task, and can deal directly with registers, memory addresses, and the contents thereof. It is easiest to understand exactly what these functions are used for when seen in the context of a simple hello world program, which we will do a little bit later.

Assembly syntax

There are two types of syntax used in assembly code: Intel and AT&T.  Each display thesame instructions, just a little bit differently (in the above examples I have used Intel syntax).  The primary difference is that the source and destination operands are flip-flopped. Look at the differences in how the syntaxes display the instruction to move the number 1 into the EAX register:

Intel Syntax: mov eax, 0x1

AT&T Syntax: mov $0x1,%eax

Besides the source (the number 1) and the destination (the EAX register) being reversed, the AT&T syntax also adds a percent sign in front of all register names and a dollar sign in front of hexadecimal numbers. Regardless of syntax however, it is still the same instruction.

You should be familiar with both syntaxes, as different disassemblers may use either one
or the other syntax when disassembling a program. For my following examples I will be using the Intel syntax since it is a little easier to understand; however, the GNU debugger (gdb), which we will be using later in this paper, uses AT&T syntax. As such, I will be supplying both the AT&T and Intel versions of the sample programs in order to give exposure to both syntaxes. For more information on the differences between AT&T and Intel syntaxes, see the gnu.org link in the references section at the end of this paper.


The Stack in Detail

The stack is a Last In, First Out (LIFO) data structure. Imagine that you are stacking plates; the first plate you put on the stack will be on the bottom; the second plate will be on top of the first plate, and the third plate will be on top of the second. When you start taking plates off of the stack, the third plate will come off first, then the second, and finally, the first. The stack section in memory operates the same way: data can be placed on the stack, but if you place three pieces of data on the stack, you will first have to remove the last two in order to access the first piece of data.

There are two types of stack operations: push and pop. When you want to place data onto the stack, you "push" it; when you want to remove data from the stack, you "pop" it. So, if you push the numbers 1, 2 and 3 in order onto the stack, when you pop the stack, you will get the number three; pop it again, and you will get the number two; pop it a third time and you will get the number one. To help visualize this, after pushing the numbers, the stack would look like:


-----------
|   1     |
-----------
|   2     |
-----------
|   3     |
----------- <---ESP

If we then pop the stack, it will look like:

-----------
|   1     |
-----------
|   2     |
----------- <---ESP

If we push the number 4 onto the top of the stack, it will look like:

-----------
|   1     |
-----------
|   2     |
-----------
|   4     |
----------- <---ESP

Don't be confused by the arrangement of the "top" and "bottom" of the stack; remember that the stack grows downwards, so data at the bottom of the stack (in this case, the number 1) is actually at the highest memory address, and the top of the stack (the number 4) is at a lower memory address. This is analogous to stacking plates on the ceiling.

Recall that the ESP register always points to the top of the stack. This means that whenever you
push data onto the stack, the address stored in ESP is decremented by the number of bytes placed onto the stack; when you pop the stack, ESP is incremented by the number of bytes removed from the stack.

Function Arguments and Local Variables
 

The stack is used to store a function's arguments and local variables; to understand how assembly instructions reference these variables, let's see how that data is arranged on the stack. Take a look at the following function and what the resulting stack layout would be:

int myFunction(int var1, int var2, int var3)
{
    char buffer1;
    char buffer2;
    char buffer3;
}

----------------------- <-----Bottom of the stack (top of memory)
|    var3             |
|---------------------|
|    var2             |
|---------------------|
|    var1             |
|---------------------|
|    Return Address   |
|---------------------|
|    Saved EBP Value  |
|---------------------| <----EBP Points here
|    buffer1          |
|---------------------|
|    buffer2          |
|---------------------|
|    buffer3          |
----------------------- <----ESP (top of the stack,                               low memory addresses)

For the moment, we will ignore the return address and saved EBP value, and concentrate on how the arguments and variables get placed onto the stack. Before a function is called, all of its arguments must first be placed on the stack. These arguments are pushed onto the stack in reverse order; that is, in our example, var3 would be pushed first, var2 second, and finally var1:

push var3
push var2
push var1
call myFunction

The call instruction will automatically place the return value onto the stack, and the saved EBP value is pushed immediately afterwards by myFunction (again, we are ignoring these values for now - more on them later). Then, the local variables are pushed onto the stack in the order which they are declared;  first buffer1, then buffer2, and lastly buffer3. When you look at the assembly code of a disassembled program however, you won't have nice names for variables like var1 or buffer1; instead they will be indicated by memory addresses, or as offsets from EBP (recall that the purpose of EBP is to reference variables on the stack). Since the function arguments are located at higher memory addresses than the address pointed to by EBP, they will be referenced as positive offsets from EBP (example: 'ebp+8'); local variables, being located at lower memory addresses, will be referenced as negative offsets from EBP (example: 'ebp-4'). So, whenever you see something referenced as an offset from EBP, you know that you are dealing with a local variable.

Return Addresses and the Prologue


Besides storing data and function arguments, the stack is also used for storing critical values when calling functions. Recall that the EIP always points to the next instruction to be executed; however, the EIP has no way of storing old instruction addresses, so when a function returns, the EIP needs a way to determine where to return to. Whenever a function is called, the memory address of the next instruction in the calling function is pushed onto the stack. When the called function finishes, this address is popped off the stack and placed into the EIP register so that the CPU can return to the next instruction in the calling function. Take the following pseudocode as an example:
 

functiona()
    var x = 1
    call functionb()
    x=0
return

When functiona calls functionb, the memory address that contains the 'x=0' assignment is pushed onto the stack. When functionb finishes, that address is popped off the stack and placed into the EIP, so the processor then knows that the next instruction it has to perform is to set the variable x equal to zero.

In addition, the value of the EBP register needs to be saved and appropriately changed when a
new function is called, such as in our above example. By now you may be wondering why the EBP is used at all; why not just reference variables from the stack pointer? The base pointer is used because as data is added to and removed from the stack, the position of the stack pointer (ESP) will be constantly changing, making it difficult to use it as a reference point for locating stack variables. However, it is impractical to use the same EBP value for every function, especially in more complex programs where you have functions inside of functions inside of functions, ad infinitum. But, just like the EIP, when a function finishes and returns control to its parent function, that parent function will need to have its original EBP value restored into the EBP register so that it can continue to reference its own variables and arguments. And, just like the EIP value, the calling function's EBP value is also placed on the stack.


However, the EBP value is not pushed onto the stack automatically; this job is up to the child
function, and the process of doing so is called the prologue. Basically what the prologue does is save the parent function's EBP value onto the stack, then gives the child function its own EBP value.  Finally, the prologue allocates enough room on the stack to hold all of the local variables. The resulting
  assembly code looks like this:

push ebp
mov ebp, esp
sub esp, 0x24

Let's take this one line at a time, shall we. The first instruction is very simple; it pushes the value in EBP (i.e., the EBP value of the calling function) onto the stack. The second instruction copies the value in ESP into the EBP register (thus giving the child function its own EBP value). Finally, the third instruction decrements the stack pointer by 36 bytes (0x24 in hexadecimal); the actual value that is subtracted from ESP will of course depend on the size and number of local variables present in the function. But what is the second instruction really doing? Why copy the stack pointer value into EBP?  To see why, look again at our sample stack layout; note the steps that have been added, and which parts of the stack are affected by them. Make particular note of where the EBP value is pointing to as well:

        ----------------------- <--Bottom of the stack (top of memory)
        |        var3         |
        |---------------------|
        |        var2         | Step 1: Arguments pushed onto the stack.
        |---------------------|
        |        var1         |
        |---------------------|
        |    Return Address   | Step 2 The call instruction pushes the return address onto the stack.

        |---------------------| 
        | Saved EBP Value     | Step 3: The prologue saves the EBP value onto the stack.
EBP --> |---------------------| 
        |        buffer1      | Step 4: The prologue allocates space on the stack for local variables by decrementing the value of ESP.
        |---------------------|
        |        buffer2      | 
        |---------------------|
        |        buffer3      |
        ----------------------- <----ESP (top of the low memory addresses)


However, when the second instruction (mov ebp, esp) is executed, only steps one through three have been performed - no space has been allocated on the stack for local variables yet. So when the ESP value is copied into the EBP register, the stack actually looks like this:

        ----------------------- <-----Bottom of the stack (top of memory)
        |        var3         |
        |---------------------|
        |        var2         |
        |---------------------|
        |        var1         |
        |---------------------|
        | Return Address      |
        |---------------------|
        | Saved EBP Value     |
        ----------------------- <----ESP (top of the stack, low memory addresses)

Note that ESP is pointing exactly where the EBP needs to be. This makes setting the new EBP value simple; before allocating space for the local variables (step four), simply copy the value of ESP into
EBP.

Some Minor Details...

The above examples have been portrayed as layouts of the program's stack; in reality, they are really just sections of the stack known as stack frames. Since each function has its own arguments and variables, each function has its own frame. A function will clean up its frame before returning, but if you have functions called inside of other functions, you will have multiple frames on the stack. For instance, if functiona() calls functionb() which calls functionc(), an overall view of that program's stack would look like:


        ----------------------- <-----Bottom of the stack (top of memory)
        | functiona() Frame   |
        |---------------------|
        | functionb() Frame   |
        |---------------------|
        | functionc() Frame   |
        ----------------------- <----Top of the stack (low memory addresses)


Reverse Engineering a Program

In this last section, we will be writing a simple hello world program in C, compiling it, then analyzing the disassembled binary. The code will be compiled with gcc and disassembled using gdb; if you are using Windows, you can get Dev-C++ from bloodshed.net which is a nice IDE that comes with all the gcc utilities, including gdb. Bear in mind that if you compile the source code yourself, your assembly code may be slightly different from mine due to variations in the different versions of gcc (I am using gcc v3.3.5 on Linux and v3.4.2 on Windows - they both produce identical assembly instructions). Also, your memory addresses probably won't match mine, but this is normal as they will  be different when compiled on different systems. Finally, we will examine the disassembly of a slightly more complex program and walk through reverse engineering it.

Using GDB

As stated earlier, gdb is both a debugger and a disassembler. In the following examples, we will be using gdb as a disassembler to perform a static analysis of our code. Gdb has many commands, but for our purposes there are just a few we will be using:


Command Example Explanation
file file helloworld Open the specified program in gdb. The program name can also be specified on the command line when starting gdb ($gdb helloworld).
disassemble  disassemble main Disassemble the specified function in the program.Gdb will display the function's assembly instructions on screen.
x x/20s 0x80403001 Examine the contents of 20 addresses as strings starting at memory address 0x80403001. If you want to view the contents in hexadecimal, replace the 's' with an 'x'.


Hello World

We will first use gdb to analyze a binary compiled from the following source code:


int main(int argc, char *argv[])
{
printf("Hello World!\n");
return 0;
}

Save this program as helloworld.c and compile it with 'gcc -o helloworld helloworld.c'; run the resulting binary and it should print "Hello World!" on the screen and exit. So far so good, now let's take a look at the assembly code:

heff@TPad:~/Programming$ gdb helloworld
GNU gdb 6.3-debian
Copyright 2004 Free Software Foundation, Inc.
GDB is free software, covered by the GNU General Public License, and you are
welcome to change it and/or distribute copies of it under certain conditions.
Type "show copying" to see the conditions.
There is absolutely no warranty for GDB. Type "show warranty" for details.
This GDB was configured as "i386-linux"...Using host libthread_db library "/lib/libthread_db.so.1".
(gdb) disassemble main
Dump of assembler code for function main:
0x08048384 <main+0>: push %ebp
0x08048385 <main+1>: mov %esp,%ebp
0x08048387 <main+3>: sub $0x8,%esp
0x0804838a <main+6>: and $0xfffffff0,%esp
0x0804838d <main+9>: mov $0x0,%eax
0x08048392 <main+14>: sub %eax,%esp
0x08048394 <main+16>: movl $0x80484c4,(%esp)
0x0804839b <main+23>: call 0x80482b0 <_init+56>
0x080483a0 <main+28>: mov $0x0,%eax
0x080483a5 <main+33>: leave
0x080483a6 <main+34>: ret
End of assembler dump.

Let's look at each instruction, keeping in mind that this disassembly is in the AT&T syntax (source on the left, destination on the right):

0x08048384 <main+0>: push %ebp
0x08048385 <main+1>: mov %esp,%ebp
0x08048387 <main+3>: sub $0x8,%esp

These three instructions should be familiar; they are the function's prologue. The ' push %ebp' instruction saves the current EBP value onto the stack; ' mov %esp,%ebp' creates the new EBP value by copying ESP into EBP; then eight bytes of space is created on the stack for local variables using the 'sub $0x8,%esp' instruction.

0x0804838a <main+6>: and $0xfffffff0,%esp
0x0804838d <main+9>: mov $0x0,%eax
0x08048392 <main+14>: sub %eax,%esp


These three instructions are used to clean up any stray bits and prepare ESP and the stack at the beginning of the program; they are present only in a program's main() function, but not any subsequent functions. The first command zeros out the last byte of the value in ESP; the next two commands put the value 0 into the EAX register, then subtracts the EAX register (aka, zero) from the stack pointer.

0x08048394 <main+16>: movl $0x80484c4,(%esp)

This instruction places the memory address 0x080484c4 onto the stack - the compiler just chose to use a different way of placing the memory address onto the stack than the standard push instruction. Note the parenthesis around %esp - this indicates a pointer. So, the mov command (AT&T syntax always uses 'movl' instead of 'mov', but they are the same instructions) is actually placing the memory address into the address pointed to by the ESP register, not directly into the ESP register itself. Perhaps you noticed that in the prologue, eight bytes were reserved on the stack for local variables, even though no variables are defined in our source code. That was necessary in order to place the memory address on the stack in this manner. If those eight bytes had not been allocated, ESP would still be pointing to the same place as EBP, and the saved EBP value would be been overwritten with the 0x080484c4 address (why the compiler uses this instead of a push instruction I don't know - that's up to the gcc developers  :).

0x0804839b <main+23>: call 0x80482b0 <_init+56>

This is a call to a function at the address 0x08482b0. Since we have only one function that is called from our code, this must be the call to printf(). There was a push instruction (or the equivalent thereof) immediately before calling printf(), so that push must have placed an argument for printf() onto the stack. Our call to printf() only has one argument: the string to print. This can be double checked by examining the contents of 0x080484c4 (the address pushed onto the stack) by issuing the command:

(gdb)x/s 0x08048384
0x8048384 <_IO_stdin_used+4>: "Hello World!\n"
(gdb)

So, this is indeed our call to printf(), and our single argument, the "Hello World!\n" string, wasappropriately placed on the stack just before it was called.

0x080483a0 <main+28>: mov $0x0,%eax

Remember that the EAX register holds any value that is returned by a function, and our main() function returns zero. So this instruction is placing the value 0 into EAX in preparation for a return.

0x080483a5 <main+33>: leave

The leave instruction cleans up the stack by removing all local variables from the stack and popping the saved EBP value off the stack into the EBP register, restoring it to its original value.

0x080483a6 <main+34>: ret

The ret instruction pops the top value off of the stack and places it into the EIP register. Since all data through he saved EBP value has been removed by the leave instruction, the top most piece of data on the stack is the saved EIP value; thus, the leave and ret instructions enable the function to properly return. Since these last three instructions (main+28 through main+34) prepare the function to return and clean up data placed on the stack by the prologue, they are known as the function's epilogue.

Here is the same disassembly, but this time printed in the Intel syntax, and commented for an easier feel of how the program flows:


0x8048384 push ebp <--- Save the EBP value on the stack
0x8048385 mov ebp,esp <--- Create a new EBP value for this function
0x8048387 sub esp,0x8 <---Allocate 8 bytes on the stack for local variables
0x804838a and esp,0xfffffff0 <---Clear the last byte of the ESP register
0x804838d mov eax,0x0 <---Place a zero in the EAX register
0x8048392 sub esp,eax <---Subtract EAX (0) from the value in ESP
0x8048394 mov DWORD PTR [esp],0x80484c4 <---Place our argument for the printf() (at address 0x08048384) onto the stack
0x804839b call 0x80482b0 <_init+56> <---Call printf()
0x80483a0 mov eax,0x0 <---Put our return value (0) into EAX
0x80483a5 leave <---Clean up the local variables and restore the EBP value
0x80483a6 ret <---Pop the saved EIP value back into the EIP register

As you can see, they are all the same instructions, just formatted a little differently; note also how the Intel syntax indicates a pointer reference as opposed to the AT&T syntax.

Disassembling Without The Source

Next, we will examine a program for which we have no source code, called helloworld2. We will attempt to reconstruct the original source code as closely as possible, and to understand how the
program operates. Let's start out by running the program to see what it does:

$./helloworld2
Hello World!
$

So far, it appears no different than our first program. We know that it prints out a string to stdout, so it probably uses the printf() function. If we are disassembling this in Linux, we can use the strings command to look for the "Hello World!" string and anything else that may be interesting:

$strings helloworld2
/lib/ld-linux.so.2
_Jv_RegisterClasses
__gmon_start__
libc.so.6
printf
_IO_stdin_used
__libc_start_main
GLIBC_2.0
PTRh@
[^_]
Hello World!
Goodbye World!

We see our "Hello World!" string, but there is also a "printf" string (indicating that the program does indeed use printf), and another interesting string, "Goodbye World!". Now, let's look at the main() function in gdb:

(gdb) disassemble main
Dump of assembler code for function main:
0x080483af <main+0>: push %ebp
0x080483b0 <main+1>: mov %esp,%ebp
0x080483b2 <main+3>: sub $0x8,%esp
0x080483b5 <main+6>: and $0xfffffff0,%esp
0x080483b8 <main+9>: mov $0x0,%eax
0x080483bd <main+14>: sub %eax,%esp
0x080483bf <main+16>: movl $0x1,0x804961c
0x080483c9 <main+26>: call 0x8048384 <myprint>
0x080483ce <main+31>: mov $0x0,%eax
0x080483d3 <main+36>: leave
0x080483d4 <main+37>: ret

Here we see the same prologue as before between main+0 and main+14. However, at main+16 we see that the number 1 is being moved into the memory address at 0x0804961c. This memory address is referenced directly, not as an offset from EBP, indicating that it is a global, not local, variable. Since the number 1 is being moved into it, it is safe to assume that this is an integer variable as well; we will call it var1. Next is a call to a function named 'myprint', which takes no arguments. Immediately afterwards we see the epilogue where 0 is moved into EAX, and leave and ret are called. So we now know that the main function simply sets a global integer variable to 1, calls a second function, then returns zero. We can reconstruct the main() function's source code to read:

int var1; /* The global integer variable */

int main()

{
    var1 = 1;
    myprint();
    return 0;
}

Next, let's examine the myprint() function:

(gdb) disassemble myprint
Dump of assembler code for function myprint:
0x08048384 <myprint+0>: push %ebp
0x08048385 <myprint+1>: mov %esp,%ebp
0x08048387 <myprint+3>: sub $0x8,%esp
0x0804838a <myprint+6>: cmpl $0x1,0x804961c
0x08048391 <myprint+13>:jne 0x80483a1 <myprint+29>
0x08048393 <myprint+15>:movl $0x80484f4,(%esp)
0x0804839a <myprint+22>:call 0x80482b0 <_init+56>
0x0804839f <myprint+27>:jmp 0x80483ad <myprint+41>
0x080483a1 <myprint+29>:movl $0x8048502,(%esp)
0x080483a8 <myprint+36>:call 0x80482b0 <_init+56>
0x080483ad <myprint+41>:leave
0x080483ae <myprint+42>:ret

We see that after the prologue, at myprint+6, there is a comparison operation. It is comparing the value stored in 0x0804961c (var1, the global variable we saw in the main() function) with the number 1. Immediately afterwards is a jne instruction. So, if var1 is not equal to 1, the the program will jump down to myprint+29, but if it is equal to 1 (which we know it is, because it was set to 1 in the main() function), it will execute the next instruction at myprint+15. Since we know that the jump will not be taken, let's look at what happens at myprint+15.

Myprint+15 pushes the memory address of 0x080484f4 onto the stack (again, using the mov instruction instead of push, but achieving the same end result), then calls a function that is located at 0x080482b0. This means that the function at 0x080482b0 is passed one argument; let's take a look at what that argument is by examining what is stored at the address 0x080484f4:

(gdb)x/s 0x080484f4
0x80484f4 <_IO_stdin_used+4>: "Hello World!\n"

This is our "Hello World!" string, and since we know that printf() is being used to print it to stdout, then the function at 0x080482b0 must be printf(). After the call to printf(), the program jumps down to myprint+41, which begins the function's epilogue. Since no value is placed in EAX before returning, and we know that the main() function does not examine EAX or place it anywhere in memory after calling the myprint() function, we can surmise that this function doesn't return a value.

But let's now look at what would happen if var1, for some reason, did not equal one. The jne instruction specifies that the program would jump down to myprint+29, which places a memory address (0x08048502) onto the stack in the same manner as before, then calls a function at 0x080482b0 - the printf() function. This means that either way printf() is called, it is just provided with a different argument. Taking a look at the contents of 0x08048502, we see that this alternate argument is the "Goodbye World!" string that we saw with the strings command earlier:


(gdb)x/s 0x08048502
0x08048502 <_IO_stdin_used+18>:"Goodbye World!\n"

We now know enough about the myprint() function to reconstruct its original source code as well:

void myprint()
{
    if(var1 == 1){
        printf("Hello World!\n");
    } else {
        printf("Goodbye World!\n");
    }
}

While there is no real purpose of the if-else statement (since var1 will always be equal to zero), I wanted to include it in order to show what a conditional statement looked like in assembly code. It is very important that you are able to recognize and understand conditional statements in assembly, as more complex comparisons (such as long case/switch statements) will be more difficult to follow.

Conclusion


This paper covered necessary background information and provided some simplistic examples in order to introduce the basic concepts of RCE. You should now have a good grasp of how to read and interpret disassembled code, identify variables and functions, and translate the assembly code back into a high-level language. In most cases however, you will be working with larger programs that are muchmore difficult to analyze; you may also be only interested in a particular part of the program, or you may want to examine all instances of a specific function. In the next paper, we will introduce some new tools and debugging techniques, as well as cover some more advanced RCE methods in order to deal with such situations.

References

Wikipedia: http://en.wikipedia.org/wiki/Reverse_engineering

Exploiting Software: http://www.informit.com/articles/article.asp?p=353553&seqNum=2&rl=1

AT&T vs Intel - http://www.gnu.org/software/binutils/manual/gas-2.9.1/html_chapter/as_16.html

Dev-C++ - http://bloodshed.net/devcpp.html

'Hacking' 카테고리의 다른 글

W32DASM Disassembler  (0) 2009.01.24
Intro to Reverse Engineering-Part 2  (0) 2009.01.24
ASProtect 1.23 RC4 - 1.3.08.24  (1) 2009.01.24
Gunz Original Files  (0) 2009.01.20
Common Hacking Tools  (0) 2009.01.20
Posted by CEOinIRVINE
l

Common Hacking Tools

Hacking 2009. 1. 20. 04:12
for those who are unable to find a non-updating launcher, the file to decompile the system.mrs, the BruteCRC32, and the Hash Tab set-up.

'Hacking' 카테고리의 다른 글

ASProtect 1.23 RC4 - 1.3.08.24  (1) 2009.01.24
Gunz Original Files  (0) 2009.01.20
IDA PRO beginner tutorial  (0) 2009.01.11
1.2.3.bmp  (0) 2009.01.10
Hex Calculator  (0) 2009.01.10
Posted by CEOinIRVINE
l

DeFixed_Edition.zip

Hacking 2009. 1. 6. 07:01

'Hacking' 카테고리의 다른 글

Inject your code into PE file  (0) 2009.01.06
SoftICE  (0) 2009.01.06
OllydbgKR.zip  (0) 2009.01.06
Gunz Hacking: LOLTASTIC.RAR 12/30/08  (0) 2009.01.01
New Mac Security News  (1) 2008.12.30
Posted by CEOinIRVINE
l

Table of Contents

Below are the topics grouped by relationship to each other:

Introduction

The purpose of this article will be to show you how to call the functions of another program through your own. This tutorial will be broken down into a series of steps, with a general example, followed up with an application of this knowledge to an actual program.

Tools needed

This article mostly uses a debugger (OllyDbg available for free to download here) and the Winject DLL injector (available for free to download online and included in callbin.zip). A C++ compiler is needed if you would like to compile the code for the DLLs. Compiling the test application and trying to work on that would most likely yield different results due to compiler settings, so it’s best to just use the one included in callbin.zip.

Why do this?

There are many reasons to reverse engineer the calls to internal functions of processes. For example, if you’ve ever seen any sort of game add-ons or “mods”, they may use this technique of calling a process' (the game's) internal functions to display text on the screen. Perhaps, you want to extend the hotkey functionality to a program. Maybe you’re interested in calling the “win” function in a game? Regardless, this technique has many wide applications than is mentioned here. The only things recommended for this tutorial are a decent knowledge of the x86 Assembly knowledge, and some knowledge of the Win32 API.

Writing our test application

Let's start off with a pre-written application, then attempt to reverse engineer it in order to see how this function is called. We'll make a simple application to do some arithmetic, and output the values through a function. Here is our test application:

#undef UNICODE

#include <windows.h>
#include <stdio.h>

void mySecretFunction(int* param1, const char* param2, 
                      DWORD param3, BYTE param4)
{
    printf("----------Function Entry----------\n");
    *param1 += 2008;
    printf("param1: %i\n", *param1);
    printf("param2: %s\n", param2);
    param3 *= *param1;
    printf("param3 (param3 *= *param1): %i\n", param3);
    param4 = 0x90;
    printf("param4: %i\n", param4);
    printf("----------Function Exit----------\n");
}
int main(void)
{
    int anArgument = 123;
    
    for(;;)
    {
    if(GetAsyncKeyState(VK_F11) & 1)
        mySecretFunction(&anArgument, 
                         "This is the original text!", 
                         123456, 4);
    else if(GetAsyncKeyState(VK_F1) & 1)
        break;
    }

    return 0;
}

This is just a function that I quickly wrote that accepts four parameters (1 by reference, 3 by value). The big advantage of writing your own and reversing it is that you already know what to look for. When trying to call a function by the address of an application that you don't have the source code to, you should be prepared to do a lot of extra work, since it’s definitely nowhere near as easy. What we're going to do is reverse engineer the debug build of this program (included in callbin.zip) to see exactly what happens step by step. Why the debug build, and not a release build with optimizations off? My personal justification for this is that it may make the analysis a bit easier for the debugger, but for this, it's pretty irrelevant. I also forgot about that idea until I finished this article in its entirety (main reason). If you were to look at the release build of this program, depending on the compiler optimizations, the mySecretFunction(...) might become inlined with main, and it would look drastically different since the parameters might be stored in static locations. Plus, since the function might possibly be inlined, attempting to call it by address would be a pretty useless search. So, let’s get to analyzing, and open up OllyDbg.

Understanding how it works

In the OllyDbg window, hit F3, and find TutExample.exe. After opening it up, you’ll see this message box pop up:

callsrc

You can just hit the OK button and continue; this warning pops up due to the nature of the debug build (built under the VS2008 IDE, for reference). Right clicking the main window and selecting Search for -> All intermodular calls, we come up with this new window:

callsrc

This window shows calls to all the functions that our executable makes. We see it call printf from MSVCR90D.dll, GetAsyncKeyState from USER32.dll, and so on. By using this, we can locate where our main() and mySecretFunction(…) are. First, let’s start with main() and see how mySecretFunction(…) gets called. Double click on one of the GetAsyncKeyState functions, and OllyDbg will take you to the address where they are called. By clicking on the top one, OllyDbg takes us to something that looks like this:

GetAsyncKeyState.jpg

Since we have the source code, we can cheat a bit, and just set a breakpoint (highlight line and press F2) on the GetAsyncKeyState, since we know that it controls whether we call mySecretFunction(…) or not. Since we don’t want to necessarily step into the function and see how USER32.dll implements it, let’s breakpoint the first GetAsyncKeyState function and continue setting breakpoints on every line up to and including the second GetAsyncKeyState function. After you’re done, you should have something that looks like this:

GetAsyncBreakpoints.jpg

So, let’s begin analyzing – hit F9 (Run program). OllyDbg should immediately hit the first breakpoint and highlight the line. Let’s hit F2 line by line, and see what it does without any interference from us. We see that the program comes to this line:

0041152A   74 1A            JE SHORT TutExamp.00411546

and takes the jump. We should also note that the key code for VK_F11 is 0x7A, which we see is pushed on the stack right before the call to GetAsyncKeyState. Now, we can analyze what this function is doing, or better yet, what it’s not doing. Let’s see what these lines that were skipped do:

0041152C   6A 04            PUSH 4
0041152E   68 40E20100      PUSH 1E240
00411533   68 EC574100      PUSH TutExamp.004157EC  ; ASCII "This is the original text!"
00411538   8D45 F8          LEA EAX,DWORD PTR SS:[EBP-8]
0041153B   50               PUSH EAX
0041153C   E8 D8FAFFFF      CALL TutExamp.00411019
00411541   83C4 10          ADD ESP,10
00411544   EB 19            JMP SHORT TutExamp.0041155F

We see that three values are pushed on the stack, then the address of one is loaded into the EAX register, which is then pushed on the stack. We then call some function, and fix the stack after it returns, and continue back into our loop. This sounds pretty familiar, and is in fact the disassembled form of:

mySecretFunction(&anArgument, "This is the original text!", 123456, 4);

The four parameters are pushed on the stack in reverse order since the stack functions as LIFO (last in first out), and then our function is called at 0x00411019. So, let’s highlight the call line, and hit Enter to take us to our function. We see it takes us to this line:

00411019   E9 A2030000      JMP TutExamp.004113C0

which is just another jump to 0x004113C0. It turns out that our function is not located at 0x00411019, but is actually located at 0x004113C0. We can just hit Enter again on this line, and go to the function at that address. Once we go to 0x004113C0, we begin to see some familiar things, such as our function entry and exit printf statements. 0x004113C0 is the address that we want to call in our program, to call this function with our custom arguments. Before we get into that though, we should at least analyze what’s going on in our function, and see how it looks disassembled. They will be especially easy to follow since they are separated with printf calls. Also, looking at the source code, you can match it right up to the disassembled code.

Deciphering the parameters

Note: Those knowledgeable in Assembly can skip this part since the functions and explanations are pretty simple.

Before even analyzing this, if we look at the beginning of the function, we see:

00413690   55               PUSH EBP
00413691   8BEC             MOV EBP,ESP
00413693   81EC C0000000    SUB ESP,0C0

This is normally called a prologue, and sets up a stack frame for the passed arguments, local variables, saved registers, and so on. At the end of this function, you will see a bunch of popped registers:

0041376E   81C4 C0000000    ADD ESP,0C0
00413774   3BEC             CMP EBP,ESP
00413776   E8 CAD9FFFF      CALL TutExamp.00411145
0041377B   8BE5             MOV ESP,EBP
0041377D   5D               POP EBP

which is called the epilogue, and restores the state of the stack so the program can continue normally once this function is finished. All of the parameters, in this case, will be accessed as something added to EBP (base pointer). Variables that are passed as parameters to a function are [EBP+0x04*n], where n can be 1, 2, 3, etc.. [EBP+0x04] is where the return address is on the stack, making [EBP+0x08] the first parameter, [EBP+0x0C] the second parameter, and so on, adding 0x04 each time to get the next parameter. Arguments are [EBP+0x04*n], local variables will be [EBP-0x04*n]. Anyway, getting back to analyzing the first part, which dereferences param1 and adds 2008 (0x7D8) to it. I’ve commented the important parts, and for the most part, it is pretty self-explanatory, given a mnemonic knowledge of Assembly language. I won’t go too much into analyzing these things in text, since the comments in the picture give a clear description of what is happening. Let’s start with param1, and work our way to param4. I’m going to explain what is happening through comments next to the important lines in the disassembly. If you want to follow along with breakpoints in the debugger, you can set a breakpoint on this line then, and start analyzing:

004113F5   8B45 08          MOV EAX,DWORD PTR SS:[EBP+8]

You may ask why we’re skipping the following lines:

004113EB   83C4 04          ADD ESP,4                             
004113EE   3BF4             CMP ESI,ESP                             
004113F0   E8 50FDFFFF      CALL TutExamp.00411145

This is because these lines don’t serve any purpose on our analysis, these three lines are just there to clean up after the printf call. Starting off:

*param1 += 2008;
printf("param1: %i\n", *param1);

Param1.jpg

printf("param2: %s\n", param2);

Setting a breakpoint at 0x00411424:

Param2.jpg

param3 *= *param1;
printf("param3 (param3 *= *param1): %i\n", param3);

Setting a breakpoint at 0x0041143D:

Param3.jpg

param4 = 0x90;
printf("param4: %i\n", param4);

Setting a breakpoint at 0x00411464:

Param4.jpg

Continuing on

Anyway, now that we’ve analyzed everything and have a good solid understanding of how this thing looks and works, we can move on. We need to somehow call the function at a specific memory address in the process. We can't call it from our own process since each process is in its own virtual space. Let’s say that this code is compiled and the executable is run as secret.exe. Let's also say that we didn't know anything about virtual memory, and we were writing an application that had a function pointing to 0x004113C0, thinking that this is mySecretFunction(..). When we attempt to call that function, we would definitely not get the results that we want (due to the process being in a different address space). So, what we need to do is inject a DLL. By doing this, we can access the memory space of our secret.exe process. Let’s see what the code for this DLL would look like.

Writing our DLL

#include <windows.h>

DWORD WINAPI MyThread(LPVOID);
DWORD g_threadID;
HMODULE g_hModule;
void __stdcall CallFunction(int&, const char*, DWORD, BYTE);

INT APIENTRY DllMain(HMODULE hDLL, DWORD Reason, LPVOID Reserved)
{
    switch(Reason)
    {
    case DLL_PROCESS_ATTACH:
        g_hModule = hDLL;
        DisableThreadLibraryCalls(hDLL);
        CreateThread(NULL, NULL, &MyThread, NULL, NULL, &g_threadID);
    break;
    case DLL_THREAD_ATTACH:
    case DLL_PROCESS_DETACH:
    case DLL_THREAD_DETACH:
        break;
    }
    return TRUE;
}

DWORD WINAPI MyThread(LPVOID)
{
    int myInt = 1;
    while(true)
    {
        if(GetAsyncKeyState(VK_F2) & 1)
        {
            CallFunction(myInt, "My custom text";, 1, 1);
        }
        else if(GetAsyncKeyState(VK_F3) &1)
            break;
    Sleep(100);
    }
    FreeLibraryAndExitThread(g_hModule, 0);
    return 0;
}

void __stdcall CallFunction(int& param1, const char* param2, DWORD param3, BYTE param4)
{
    typedef void (__stdcall *pFunctionAddress)(int&, const char*, DWORD, BYTE);
    pFunctionAddress pMySecretFunction = (pFunctionAddress)(0x004113C0);
    pMySecretFunction(param1, param2, param3, param4);
}

Starting off, it's pretty simple. We create a thread inside of the process that we injected this DLL into, and set up a loop waiting for our key press. Once we press F2, we should call our function, which in turns calls the internal function of the process. However, we get to pass our own parameters instead of the ones hardcoded into the original file. Our CallFunction(…) function has the same exact declaration as mySecretFunction(…), and in it, we set up a function pointer. We choose the __stdcall calling convention because it is the most common one that the C++ compiler uses. If need be, we could’ve further analyzed our disassembled executable, and seen how the stack is being cleaned up, in order to deduce whether another one such as __cdecl is being used instead. What we’re doing is creating a function pointer to address 0x004113C0 in the executable, which is the address that we found earlier to mySecretFunction(…). Once we find it, we call it with our custom parameters. So, let’s test this and see. Running the compiled code from the very beginning of this tutorial, we see this:

NoInject.jpg

This looks normal, and is completely expected behavior from the program. Now, let’s inject our DLL, and see what happens when we press F2.

Inject.jpg

We can clearly see that something is different. But, is it what we expected? Let’s look at our parameters, and see what they should be according to the code of mySecretFunction(…). We passed 1, “My custom text”, 1, 1 to the function. 1 += 2008 = 2009 (correct). “My custom text” was outputted (correct). 1 *= 2009 = 2009 (correct). Param4 set equal to 0x90 (144 decimal, correct). It looks like everything worked perfectly. We can continue to press F11 to get the original function, or we can press F2 and get our custom one, but clearly, we see that something is different, and that we can choose to call this function with our own parameters.

Passing the right parameters

An important thing to note is that it is very important to be careful with the data types. You should always step through each piece, and see what it is outputting. Later on, if we were to somehow mistake param2 for an int, instead of a const char*, we would be getting some unexpected results, or even have the program crash due to problems with memory. Viewing the address relative to EBP, we would see that param2 holds characters, while param1, param3, and param4 hold numbers of some type. Let’s examine some cases where we don’t necessarily declare the same parameter types as the original function, and see what happens. We should investigate a few variations, namely:

  • Not using const char* as param2.
  • Using different number based data types for param1/3/4.

Let’s start with the first case. Going from top to bottom in the DLL code, here are the lines and what we change them to.

void __stdcall CallFunction(int&, int, DWORD, BYTE);
CallFunction(myInt, 12345, 1, 1);
void __stdcall CallFunction(int& param1, int param2, DWORD param3, BYTE param4)
typedef void (__stdcall *pFunctionAddress)(int&, int, DWORD, BYTE);

So, after making these changes, injecting our new DLL into the process, we can hit F11 and be greeted by a familiar message. However, when we hit F2, we see that the program crashes right at the point of outputting param2. There’s really not much to say about this except to be careful, and work with proper data types when it comes to two different things such as const char* and a numeric type. What happens if we change one of the other parameters then? Will the program still crash if we were to change the third parameter from DWORD to BYTE? The short answer is “no”; at least, this one won’t (you can try for yourself). We do, however, get some unexpected output from our parameters, which sort of makes calling the function useless if it doesn’t give us what we expect. The issue about our program not crashing is not universal either; it’s rather the exception than the rule. Programs may or may not crash depending on what is done with the parameters. Ours consists of just adding, multiplyin, and outputting; others may not be so friendly to taking BYTE types instead of DWORDs, or likewise.

Applying this to a real application

Now, on to a practical example where we don’t know the source code and we need to do some guess work. As much as I don’t like giving simple programs such as Minesweeper or the standard Windows games as “real” examples, I can’t think of anything else of use that’s as common on desktops as these games, and where this technique can be used to achieve something truly useful. My real world example would be a large application or a game with lots of functionality where calling their functions can yield some really cool looking results. However, I would imagine that’s of too questionable legality, and also would violate some article submission guidelines of CodeProject. Anyway, let’s start our Minesweeper game, and see where we can apply this technique. Our window:

Minesweeper.jpg

So, where would we apply this technique? Personally, I’m thinking that it’d be nice if we had a hotkey that would win the game for us. Let’s go to it then; but, before we start, we should lay out exactly what we’re going to do. Our objective is to:

  • Find the function that Minesweeper uses that wins the game.
  • See what parameters it takes, and how it works.
  • Write a DLL that we can inject, and set a hotkey to call this function for us.

Finding the function

But, how do we find this mystery function? There are a number of ways to go from here, each with varying difficulty. My approach to this problem is to see how the game behaves when you win a game. I noticed that if I had sound enabled, the game would play a sound when I won a game (or the clock ticked, or I hit a bomb). We can use this information and track down the API that plays the sound, then working backwards, we can come upon the function that is executed when you win the game. So, open the game up in OllyDbg, and hit F9 (Run program). After doing this, you can hit Ctrl+A and let OllyDbg analyze the code some more. We’re looking for an API that plays sound; so, right click the main window, and go to Search for -> All Intermodular calls. You’ll be greeted with a pretty large list, larger than the one in the sample program. Click the “Destination” tab to sort these in alphabetical order by API name. There are tons of APIs, but something should catch our eye.

PlaySound.jpg

PlaySoundW sounds pretty interesting. According to MSDN, here is what the PlaySound API does:

The PlaySound function plays a sound specified by the given file name, resource, or system event. (A system event may be associated with a sound in the Registry or in the WIN.INI file.)

BOOL PlaySound(
  LPCTSTR pszSound,  
  HMODULE hmod,     
  DWORD fdwSound    
);

This is definitely what we want, so let’s set a breakpoint on all three of them. After doing this, we should go back to the main Minesweeper window, and click on a tile to start a game. Immediately after that, we should hit a breakpoint at:

01003937  |> FF15 68110001  CALL DWORD PTR DS:[<&WINMM.PlaySoundW>]  ;  WINMM.PlaySoundW

If we hit F9 to continue running this program, we will see that this specific one is called each time the timer increases by 1. If we take the breakpoint off and continue, we see that this API doesn’t get called anymore when the timer increases. However, it also does not get called when you win or lose a game. This means that this specific one is responsible for all three, and that working backwards, we can see what is calling it.

Jumps.jpg

We see that we’ve got jumps to this function from 0x01003913 and 0x01003925. So, let’s set breakpoints on them, and see what is going on.

01003903  |. 68 05000400    PUSH 40005                   ;  Case 3 of switch 010038FA
01003908  |. FF35 305B0001  PUSH DWORD PTR DS:[1005B30]  ;  WINMINE.01000000
0100390E  |. 68 B2010000    PUSH 1B2
01003913  |. EB 22          JMP SHORT WINMINE.01003937
01003915  |> 68 05000400    PUSH 40005                   ;  Case 2 of switch 010038FA
0100391A  |. FF35 305B0001  PUSH DWORD PTR DS:[1005B30]  ;  WINMINE.01000000
01003920     68 B1010000    PUSH 1B1
01003925  |. EB 10          JMP SHORT WINMINE.01003937

We see these two segments are pushing three parameters on the stack, and then calling PlaySoundW. If we take note from earlier, the LPCTSTR pszSound parameter of the ticking noise is 0x1B0. Here, we have 0x1B2 and 0x1B1. Just by using logic, you can guess that these two correspond to the explosion sound and the victory sound. But, which one? That’s what we’re going to test. Let’s set a breakpoint on each one, and see. We notice that if we start a new game and happen to come upon a bomb, we get a breakpoint at:

0100390E  |. 68 B2010000    PUSH 1B2

If we win a game, 0x1B1 is pushed. So, we have 0x1B2 as the explosion sound, 0x1B1 as the victory sound, and 0x1B0 as the ticking sound. Therefore, the critical piece of the code is this:

01003915  |> 68 05000400    PUSH 40005                   ;  Case 2 of switch 010038FA
0100391A  |. FF35 305B0001  PUSH DWORD PTR DS:[1005B30]  ;  WINMINE.01000000
01003920     68 B1010000    PUSH 1B1
01003925  |. EB 10          JMP SHORT WINMINE.01003937

Now, working backwards again, we want to find what calls this. If we click on 0x01003915, we see this in the main window:

Jumps1.jpg

Note: we can also right click the command and go to Find references to -> Selected command (Ctrl+R). Going backwards once again to 0x010038FE and investigating what is around there, we come upon this block of code, with 0x010038ED as the beginning of this whole function:

010038ED  /$ 833D B8560001 >CMP DWORD PTR DS:[10056B8],3
010038F4  |. 75 47          JNZ SHORT WINMINE.0100393D
010038F6  |. 8B4424 04      MOV EAX,DWORD PTR SS:[ESP+4]
010038FA  |. 48             DEC EAX                      ;  Switch (cases 1..3)
010038FB  |. 74 2A          JE SHORT WINMINE.01003927
010038FD  |. 48             DEC EAX
010038FE  |. 74 15          JE SHORT WINMINE.01003915
01003900  |. 48             DEC EAX
01003901  |. 75 3A          JNZ SHORT WINMINE.0100393D

We see that the value in 10056B8 gets compared with 3, which we can deduce as three cases of a switch statement. The value of [ESP+4] is moved into EAX, and then we see what it is and takes a corresponding action. We’re not quite there yet, but it seems that we’re getting close. Let’s go to the top of the function and see what calls this. Select the line, and hit Ctrl+R to see what’s calling this.

Jumps3.jpg

Let’s set a breakpoint on all three, and start a new game. Immediately, we should hit this:

0100382B  |. E8 BD000000    CALL WINMINE.010038ED

Since we haven’t even started playing yet, let alone won, we should just remove the breakpoint and move on. A second or two after we continue, we hit this line:

01003002  |. E8 E6080000    CALL WINMINE.010038ED

This isn’t what we want either. We’ve got it narrowed down to one now.

010034CF  |. E8 19040000    CALL WINMINE.010038ED

If we experiment around a bit, we can see that 0x010034CF is called when we win or lose a game. Now, we just have to make the distinction and find out what determines whether we win or lose. Let’s take a look at this function as a whole:

0100347C  /$ 8325 64510001 >AND DWORD PTR DS:[1005164],0
01003483  |. 56             PUSH ESI
01003484  |. 8B7424 08      MOV ESI,DWORD PTR SS:[ESP+8]
01003488  |. 33C0           XOR EAX,EAX
0100348A  |. 85F6           TEST ESI,ESI
0100348C  |. 0F95C0         SETNE AL
0100348F  |. 40             INC EAX
01003490  |. 40             INC EAX
01003491  |. 50             PUSH EAX
01003492  |. A3 60510001    MOV DWORD PTR DS:[1005160],EAX
01003497  |. E8 77F4FFFF    CALL WINMINE.01002913
0100349C  |. 33C0           XOR EAX,EAX
0100349E  |. 85F6           TEST ESI,ESI
010034A0  |. 0F95C0         SETNE AL
010034A3  |. 8D0485 0A00000>LEA EAX,DWORD PTR DS:[EAX*4+A]
010034AA  |. 50             PUSH EAX
010034AB  |. E8 D0FAFFFF    CALL WINMINE.01002F80
010034B0  |. 85F6           TEST ESI,ESI
010034B2  |. 74 11          JE SHORT WINMINE.010034C5                
010034B4  |. A1 94510001    MOV EAX,DWORD PTR DS:[1005194]
010034B9  |. 85C0           TEST EAX,EAX
010034BB  |. 74 08          JE SHORT WINMINE.010034C5
010034BD  |. F7D8           NEG EAX
010034BF  |. 50             PUSH EAX
010034C0  |. E8 A5FFFFFF    CALL WINMINE.0100346A
010034C5  |> 8BC6           MOV EAX,ESI                              
010034C7  |. F7D8           NEG EAX
010034C9  |. 1BC0           SBB EAX,EAX
010034CB  |. 83C0 03        ADD EAX,3
010034CE  |. 50             PUSH EAX
010034CF  |. E8 19040000    CALL WINMINE.010038ED                    
010034D4  |. 85F6           TEST ESI,ESI
010034D6  |. C705 00500001 >MOV DWORD PTR DS:[1005000],10
010034E0  |. 5E             POP ESI
010034E1  |. 74 2C          JE SHORT WINMINE.0100350F                
010034E3  |. 66:A1 A0560001 MOV AX,WORD PTR DS:[10056A0]
010034E9  |. 66:3D 0300     CMP AX,3
010034ED  |. 74 20          JE SHORT WINMINE.0100350F                
010034EF  |. 8B0D 9C570001  MOV ECX,DWORD PTR DS:[100579C]
010034F5  |. 0FB7C0         MOVZX EAX,AX
010034F8  |. 8D0485 CC56000>LEA EAX,DWORD PTR DS:[EAX*4+10056CC]
010034FF  |. 3B08           CMP ECX,DWORD PTR DS:[EAX]
01003501  |. 7D 0C          JGE SHORT WINMINE.0100350F
01003503  |. 8908           MOV DWORD PTR DS:[EAX],ECX
01003505  |. E8 77E6FFFF    CALL WINMINE.01001B81                    
0100350A  |. E8 9BE6FFFF    CALL WINMINE.01001BAA                   
0100350F  \> C2 0400        RETN 4

Let’s set a breakpoint on each line from the beginning of the function, all the way up to the end of the return statement. Since this function is called when you win and when you lose, you can begin by checking what parts of it are skipped when these conditions happen. After setting a breakpoint on all of these lines and losing a game, we find that these lines are skipped.

010034B4  |. A1 94510001    MOV EAX,DWORD PTR DS:[1005194]
010034B9  |. 85C0           TEST EAX,EAX
010034BB  |. 74 08          JE SHORT WINMINE.010034C5
010034BD  |. F7D8           NEG EAX
010034BF  |. 50             PUSH EAX
010034C0  |. E8 A5FFFFFF    CALL WINMINE.0100346A

We also find that the last statement of the function to be executed when you lose is:

010034E1  |. 74 2C          JE SHORT WINMINE.0100350F

Now, to see what happens when you win. We find that the function gets executed in its entirety.

Note: If you’re following along in a debugger and your game stops at this line:

010034ED  |. 74 20          JE SHORT WINMINE.0100350F

that is because the lines that come after this are to check to see whether you are eligible for the high score table.

So, what is the difference that determines the jump? We come to these lines:

010034B0  |. 85F6           TEST ESI,ESI
010034B2  |. 74 11          JE SHORT WINMINE.010034C5

Here, we’re testing to see if ESI is 0, and if so, we take the jump that skips over the section dealing with a won game. In other words, if ESI is 0, then we have lost. To see what the value of ESI is when we win, we can simply check the value of it in OllyDbg at that line.

ESI.jpg

We see that the value for ESI when we win is 1. So, where is ESI set? If we examine the function, we can see that near the beginning, there is this line:

01003484  |. 8B7424 08      MOV ESI,DWORD PTR SS:[ESP+8]

The first parameter into this function is moved into ESI. Why ESP, and not EBP as in the original example? This is because this function does not set up a stack frame like the other one, so the parameters are accessed through ESP instead of EBP. We see that the highest value of ESP is +8, and that this function returns 4, so we can deduce that it only takes one parameter. We can even verify this by checking the references to 0x0100347C and seeing only one PUSH statement before the call. We’ve achieved two out of three of our original objectives, so now, all that’s left is to just write our DLL to make a hotkey that calls this function with 1 as a parameter. Since we’re moving this parameter into a 32-bit register, we can have it as a type DWORD in our DLL (despite the DWORD PTR in the disassembly). In case anyone is interested in a description of the entire function, below are my notes from stepping through and quickly glancing over what happens.

MineAnalysis.jpg

Writing our new DLL

Here, we can use the template of the DLL for the original function. There are just a few trivial things to change around. The new code is shown below:

#include <windows.h>

DWORD WINAPI MyThread(LPVOID);
DWORD g_threadID;
HMODULE g_hModule;
void __stdcall CallFunction(void);

INT APIENTRY DllMain(HMODULE hDLL, DWORD Reason, LPVOID Reserved)
{
    switch(Reason)
    {
    case DLL_PROCESS_ATTACH:
        g_hModule = hDLL;
        DisableThreadLibraryCalls(hDLL);
        CreateThread(NULL, NULL, &MyThread, NULL, NULL, &g_threadID);
    break;
    case DLL_THREAD_ATTACH:
    case DLL_PROCESS_DETACH:
    case DLL_THREAD_DETACH:
        break;
    }
    return TRUE;
}

DWORD WINAPI MyThread(LPVOID)
{
    while(true)
    {
        if(GetAsyncKeyState(VK_F3) & 1) //Set F3 as our hotkey
        {
            CallFunction();
        }
        else if(GetAsyncKeyState(VK_F4) & 1)
            break;
    Sleep(100);
    }
    FreeLibraryAndExitThread(g_hModule, 0);
    return 0;
}

void __stdcall CallFunction(void)
{
    typedef void (__stdcall *pFunctionAddress)(DWORD);
    pFunctionAddress pWinFunction = (pFunctionAddress)(0x0100347C); //Our new address
    pWinFunction(1); //Call it with 1 to win the game
}

Let’s test it out just for good measure. Start up a new instance of Minesweeper, and inject the DLL. Click on one of the tiles to start the game, then hit the F3 hotkey. The result? Hopefully, something similar to this.

MineWin.jpg

You’ll notice that the full board doesn’t get revealed when you win, but that can be left as an exercise for the reader :-).

'Hacking' 카테고리의 다른 글

Gunz Hacking: LOLTASTIC.RAR 12/30/08  (0) 2009.01.01
New Mac Security News  (1) 2008.12.30
Win32 Assembler Coding for Crackers by Goppit  (0) 2008.12.25
Ollydbg Tutorial Beginners  (0) 2008.12.25
ART Tutorial  (0) 2008.12.25
Posted by CEOinIRVINE
l

Reverse Engineering (BASIC)

Hacking 2008. 12. 22. 15:59
1. PEID Download
2. Unpack DLL
3. Use your favorite debugger (such as ollydbg)
4. Analysis~~~
6A 52            -> PUSH 52                                                                     ->Key=52('R')
2E:FF15 1C92 -> CALL DWORD PTR CS:[<&USER32.GetAsyncKeyState>] -> GetAsyncKeyState


Means...Users type 'R' Key :)


'Hacking' 카테고리의 다른 글

IBM PC Keyboard Scan Codes  (1) 2008.12.23
Creating .DLL's  (0) 2008.12.23
Gunz Hacking  (0) 2008.12.19
Mozilla Firefox 2 Multiple Vulnerabilities  (0) 2008.12.18
Red Hat Update for Kernel  (0) 2008.12.18
Posted by CEOinIRVINE
l

Assembler : The Basics In Reversing


Indeed: the basics!! This is all far from complete but covers about everything you need to know about assembler to start on your reversing journey! Assembler is the start and the end of all programming languages. After all, all (computer LOL) languages are translated to assembler. In most languages we deal with relatively clear syntaxes. However, it's a completely other story in assembler where we use abbreviations and numbers and where it all seems so weird …


I. Pieces, bits and bytes:


·         BIT - The smallest possible piece of data. It can be either a 0 or a 1. If you put a bunch of bits together, you end up in the 'binary number system'


i.e. 00000001 = 1       00000010 = 2             00000011 = 3     etc.


·         BYTE - A byte consists of 8 bits. It can have a maximal value of 255 (0-255). To make it easier to read binary numbers, we use the 'hexadecimal number system'. It's a 'base-16 system', while binary is a 'base-2 system'


·         WORD - A word is just 2 bytes put together or 16 bits. A word can have a maximal value of 0FFFFh (or 65535d).


·         DOUBLE WORD - A double word is 2 words together or 32 bits. Max value = 0FFFFFFFF (or 4294967295d).


·         KILOBYTE - 1000 bytes? No, a kilobyte does NOT equal 1000 bytes! Actually, there are 1024 (32*32) bytes.


·         MEGABYTE - Again, not just 1 million bytes, but 1024*1024 or 1,048,578 bytes.


---------------------------------------------------------------------------------------------


II. Registers:


Registers are “special places” in your computer's memory where we can store data. You can see a register as a little box, wherein we can store something: a name, a number, a sentence. You can see a register as a placeholder.


On today’s average WinTel CPU you have 9 32bit registers (w/o flag registers). Their names are:


EAX:   Extended Accumulator Register

EBX:   Extended Base Register

ECX:   Extended Counter Register

EDX:   Extended Data Register

ESI:    Extended Source Index

EDI:   Extended Destination Index

EBP:   Extended Base Pointer

ESP:   Extended Stack Pointer

EIP:    Extended Instruction Pointer


Generally the size of the registers is 32bit (=4 bytes). They can hold data from 0-FFFFFFFF (unsigned). In the beginning most registers had certain main functions which the names imply, like ECX = Counter, but in these days you can - nearly - use whichever register you like for a counter or stuff (only the self defined ones, there are counter-functions which need to be used with ECX). The functions of EAX, EBX, ECX, EDX, ESI and EDI will be explained when I explain certain functions that use those registers. So, there are EBP, ESP, EIP left:


EBP:   EBP has mostly to do with stack and stack frames. Nothing you really need to worry about, when you start. ;)


ESP:   ESP points to the stack of a current process. The stack is the place where data can be stored for later use (for more information, see the explanation of the push/pop instructions)


EIP:    EIP always points to the next instruction that is to be executed.


There's one more thing you have to know about registers: although they are all 32bits large, some parts of them (16bit or even 8bit) can not be addressed directly.


The possibilities are:


32bit Register                       16bit Register                      8bit Register

EAX                                  AX                             AH/AL

EBX                                  BX                              BH/BL

ECX                                  CX                             CH/CL

EDX                                  DX                             DH/DL

ESI                                   SI                              -----

EDI                                   DI                              -----

EBP                        BP                             -----

ESP                                  SP                             -----

EIP                                   IP                              -----


A register looks generally this way:


     |--------------------------- EAX: 32bit (=1 DWORD =4BYTES) -------------------------|


                                               |------- AX: 16bit (=1 WORD =2 BYTES) ----|


                                               |- AH:8bit (=1 BYTE)-|- AL:8bit (=1 BYTE)-|


     |-----------------------------------------|--------------------|--------------------|

     |XXXXXXXXXXXXXXXXXXXXXXXXXXXXXXXXXXXXXXXXX|XXXXXXXXXXXXXXXXXXXX|XXXXXXXXXXXXXXXXXXXX|

     |-----------------------------------------|--------------------|--------------------|


So, EAX is the name of the 32bit register, AX is the name of the "Low Word" (16bit) of EAX and AL/AH (8bit) are the “names” of the "Low Part" and “High Part” of AX. BTW, 4 bytes is 1 DWORD, 2 bytes is 1 WORD.


REMARK: make sure you at least read the following about registers. It’s quite practical to know it although not that important.


All this makes it possible for us to make a distinction regarding size:


·         i. byte-size registers: As the name says, these registers all exactly 1 byte in size. This does not mean that the whole (32bit) register is fully loaded with data! Eventually empty spaces in a register are just filled with zeroes. These are the byte-sized registers, all 1 byte or 8 bits in size:

o    AL  and AH

o    BL  and BH

o    CL  and CH

o    DL  and DH

·         ii. word-size registers: Are 1 word (= 2 bytes = 16 bits) in size. A word-sized register is constructed of 2 byte-sized registers. Again, we can divide these regarding their purpose:


o    1. general purpose registers:


AX (word-sized) = AH + AL -> the '+' does *not* mean: 'add them up'. AH and AL exist independently, but together they form AX. This means that if you change AH or AL (or both), AX will change too!


-> 'accumulator':               used to mathematical operations, store strings,..

BX -> 'base':                         used in conjunction with the stack (see later)

CX -> 'counter'

DX -> 'data':                         mostly, here the remainder of mathematical operations is stored

DI  -> 'destination index':         i.e. a string will be copied to DI

SI  -> 'source index':              i.e. a string will be copied from SI


o    2. index registers:


BP  -> 'base pointer':               points to a specified position on the stack (see later)
     SP  -> 'stack pointer':              points to a specified position on the stack (see later)


o    3. segment registers:


     CS -> 'code segment':             instructions an application has to execute (see later)
     DS -> 'data segment':             the data your application needs (see later)
     ES -> 'extra segment':            duh! (see later)
     SS -> 'stack segment':            here we'll find the stack (see later)


o    4. special:
  

IP  -> 'instruction pointer':       points to the next instruction. Just leave it alone ;)


·         iii. Doubleword-size registers:


2 words = 4 bytes = 32 bits. EAX, EBX, ECX, EDX, EDI…


If you find an 'E' in front of a 16-bits register, it means that you are dealing with a 32-bits register. So, AX = 16-bits; EAX = the 32-bits version of EAX.


---------------------------------------------------------------------------------------------


III. The flags:


Flags are single bits which indicate the status of something. The flag register on modern 32bit CPUs is 32bit large. There are 32 different flags, but don't worry. You will mostly only need 3 of them in reversing. The Z-Flag, the O-Flag and the C-Flag. For reversing you need to know these flags to understand if a jump is executed or not. This register is in fact a collection of different 1-bit flags. A flag is a sign, just like a green light means: 'ok' and a red one 'not ok'. A flag can only be '0' or '1', meaning 'not set' or 'set'.


·         The Z-Flag:

o    The Z-Flag (zero flag) is the most useful flag for cracking. It is used in about 90% of all cases. It can be set (status: 1) or cleared (status: 0) by several opcodes when the last instruction that was performed has 0 as result. You might wonder why "CMP" (more on this later) could set the zero flag, because it compares something - how can the result of the comparison be 0? The answer on this comes later ;)


·         The O-Flag:

o    The O-Flag (overflow flag) is used in about 4% of all cracking attempts. It is set (status: 1) when the last operation changed the highest bit of the register that gets the result of an operation. For example: EAX holds the value 7FFFFFFF. If you use an operation now, which increases EAX by 1 the O-Flag would be set, because the operation changed the highest bit of EAX (which is not set in 7FFFFFFF, but set in 80000000 - use calc.exe to convert hexadecimal values to binary values). Another need for the O-Flag to be set, is that the value of the destination register is neither 0 before the instruction nor after it.


·         The C-Flag:

o    The C-Flag (Carry flag) is used in about 1% of all cracking attempts. It is set, if you add a value to a register, so that it gets bigger than FFFFFFFF or if you subtract a value, so that the register value gets smaller than 0.


---------------------------------------------------------------------------------------------


IV. Segments en offsets


A segment is a piece in memory where instructions (CS), data (DS), the stack (SS) or just an extra segment (ES) are stored. Every segment is divided in 'offsets'. In 32-bits applications (Windows 95/98/ME/2000), these offsets are numbered from 00000000 to FFFFFFFF. 65536 pieces of memory thus 65536 memory addresses per segment. The standard notation for segments and offsets is:


SEGMENT                                  :        OFFSET        =       Together, they point to a specific place (address) in memory.


See it like this:


A segment is a page in a book     :        An offset is a specific line at that page.


---------------------------------------------------------------------------------------------


V. The stack:


The Stack is a part in memory where you can store different things for later use. See t as a pile of books in a chest where the last put in is the first to grab out. Or imagine the stack as a paper basket where you put in sheets. The basket is the stack and a sheet is a memory address (indicated by the stack pointer) in that stack segment. Remember following rule: the last sheet of paper you put in the stack, is the first one you'll take out! The command 'push' saves the contents of a register onto the stack. The command 'pop' grabs the last saved contents of a register from the stack and puts it in a specific register.


---------------------------------------------------------------------------------------------


VI. INSTRUCTIONS (alphabetical)


Please note, that all values in ASM mnemonics (instructions) are *always* hexadecimal.


Most instructions have two operators (like "add EAX, EBX"), but some have one ("not EAX") or even three ("IMUL EAX, EDX, 64"). When you have an instruction that says something with "DWORD PTR [XXX]" then the DWORD (4 byte) value at memory offset [XXX] is meant. Note that the bytes are saved in reverse order in the memory (WinTel CPUs use the so called “Little Endian” format. The same is for "WORD PTR [XXX]" (2 byte) and "BYTE PTR [XXX]" (1 byte).


Most instructions with 2 operators can be used in the following ways (example: add):


add eax,ebx                                         ;; Register, Register

add eax,123                                         ;; Register, Value

add eax,dword ptr [404000]                    ;; Register, Dword Pointer [value]

add eax,dword ptr [eax]                         ;; Register, Dword Pointer [register]

add eax,dword ptr [eax+00404000] ;; Register, Dword Pointer [register+value]

add dword ptr [404000],eax                    ;; Dword Pointer [value], Register

add dword ptr [404000],123           ;; Dword Pointer [value], Value

add dword ptr [eax],eax                         ;; Dword Pointer [register], Register

add dword ptr [eax],123                         ;; Dword Pointer [register], Value

add dword ptr [eax+404000],eax             ;; Dword Pointer [register+value], Register

add dword ptr [eax+404000],123             ;; Dword Pointer [register+value], value


---------------------------------------------------------------------------------------------


     ADD (Addition)

     Syntax: ADD destination, source


     The ADD instruction adds a value to a register or a memory address. It can be used in

     these ways:


     These instruction can set the Z-Flag, the O-Flag and the C-Flag (and some others, which

     are not needed for cracking).


---------------------------------------------------------------------------------------------


     AND (Logical And)

     Syntax: AND destination, source    


     The AND instruction uses a logical AND on two values.

     This instruction *will* clear the O-Flag and the C-Flag and can set the Z-Flag.

     To understand AND better, consider those two binary values:


                                    1001010110

                                    0101001101


     If you AND them, the result is 0001000100

     When two 1 stand below each other, the result is of this bit is 1, if not: The result

     is 0. You can use calc.exe to calculate AND easily.


---------------------------------------------------------------------------------------------


     CALL (Call)

     Syntax: CALL something


     The instruction CALL pushes the RVA (Relative Virtual Address) of the instruction that

     follows the CALL to the stack and calls a sub program/procedure.


     CALL can be used in the following ways:


     CALL        404000                             ;; MOST COMMON: CALL ADDRESS

     CALL        EAX                                 ;; CALL REGISTER - IF EAX WOULD BE 404000 IT WOULD BE SAME AS THE ONE ABOVE

     CALL        DWORD PTR [EAX]             ;; CALLS THE ADDRESS THAT IS STORED AT [EAX]

     CALL        DWORD PTR [EAX+5]                   ;; CALLS THE ADDRESS THAT IS STORED AT [EAX+5]


---------------------------------------------------------------------------------------------


     CDQ (Convert DWord (4Byte) to QWord (8 Byte))

     Syntax: CQD


     CDQ is an instruction that always confuses newbies when it appears first time. It is

     mostly used in front of divisions and does nothing else then setting all bytes of EDX

     to the value of the highest bit of EAX. (That is: if EAX <80000000, then EDX will be

     00000000; if EAX >= 80000000, EDX will be FFFFFFFF).


---------------------------------------------------------------------------------------------


     CMP (Compare)

     Syntax: CMP dest, source


     The CMP instruction compares two things and can set the C/O/Z flags if the result fits.


     CMP         EAX, EBX                          ;; compares eax and ebx and sets z-flag if they are equal

     CMP         EAX,[404000]                    ;; compares eax with the dword at 404000

     CMP         [404000],EAX                    ;; compares eax with the dword at 404000


---------------------------------------------------------------------------------------------


     DEC (Decrement)

     Syntax: DEC something


     dec is used to decrease a value (that is: value=value-1)


     dec can be used in the following ways:

     dec eax                                          ;; decrease eax

     dec [eax]                                        ;; decrease the dword that is stored at [eax]

     dec [401000]                                   ;; decrease the dword that is stored at [401000]

     dec [eax+401000]                            ;; decrease the dword that is stored at [eax+401000]


     The dec instruction can set the Z/O flags if the result fits.


---------------------------------------------------------------------------------------------


     DIV (Division)

     Syntax: DIV divisor


     DIV is used to divide EAX through divisor (unsigned division). The dividend is always

     EAX, the result is stored in EAX, the modulo-value in EDX.


     An example:

     mov eax,64                                     ;; EAX = 64h = 100

     mov ecx,9                                       ;; ECX = 9

     div ecx                                           ;; DIVIDE EAX THROUGH ECX


     After the division EAX = 100/9 = 0B and ECX = 100 MOD 9 = 1


     The div instruction can set the C/O/Z flags if the result fits.


---------------------------------------------------------------------------------------------


     IDIV (Integer Division)

     Syntax: IDIV divisor


     The IDIV works in the same way as DIV, but IDIV is a signed division.

     The idiv instruction can set the C/O/Z flags if the result fits.


---------------------------------------------------------------------------------------------


     IMUL (Integer Multiplication)

     Syntax:    IMUL value

                   IMUL dest,value,value

                   IMUL dest,value


     IMUL multiplies either EAX with value (IMUL value) or it multiplies two values and puts

     them into a destination register (IMUL dest, value, value) or it multiplies a register

     with a value (IMUL dest, value).


     If the multiplication result is too big to fit into the destination register, the

     O/C flags are set. The Z flag can be set, too.


---------------------------------------------------------------------------------------------


     INC (Increment)

     Syntax: INC register


     INC is the opposite of the DEC instruction; it increases values by 1.

     INC can set the Z/O flags.


---------------------------------------------------------------------------------------------


      INT

     Syntax: int dest


     Generates a call to an interrupt handler. The dest value must be an integer (e.g., Int 21h).

     INT3 and INTO are interrupt calls that take no parameters but call the handlers for

     interrupts 3 and 4, respectively.


---------------------------------------------------------------------------------------------


     JUMPS

     These are the most important jumps and the condition that needs to be met, so that

     they'll be executed (Important jumps are marked with * and very important with **):


JA*     -        Jump if (unsigned) above                        - CF=0 and ZF=0

JAE     -        Jump if (unsigned) above or equal            - CF=0

JB*     -        Jump if (unsigned) below                        - CF=1

JBE     -        Jump if (unsigned) below or equal            - CF=1 or ZF=1

JC       -        Jump if carry flag set                             - CF=1

JCXZ   -        Jump if CX is 0                                      - CX=0

JE**    -        Jump if equal                                        - ZF=1

JECXZ  -        Jump if ECX is 0                                    - ECX=0

JG*     -        Jump if (signed) greater                         - ZF=0 and SF=OF (SF = Sign Flag)

JGE*   -        Jump if (signed) greater or equal             - SF=OF

JL*      -        Jump if (signed) less                              - SF != OF (!= is not)

JLE*    -        Jump if (signed) less or equal                  - ZF=1 and OF != OF

JMP**  -        Jump                                                   - Jumps always

JNA     -        Jump if (unsigned) not above                   - CF=1 or ZF=1

JNAE   -        Jump if (unsigned) not above or equal       - CF=1

JNB     -        Jump if (unsigned) not below                   - CF=0

JNBE   -        Jump if (unsigned) not below or equal       - CF=0 and ZF=0

JNC     -        Jump if carry flag not set                        - CF=0

JNE**  -        Jump if not equal                                   - ZF=0

JNG     -        Jump if (signed) not greater                    - ZF=1 or SF!=OF

JNGE   -        Jump if (signed) not greater or equal        - SF!=OF

JNL     -        Jump if (signed) not less                         - SF=OF

JNLE    -        Jump if (signed) not less or equal             - ZF=0 and SF=OF

JNO     -        Jump if overflow flag not set                   - OF=0

JNP     -        Jump if parity flag not set                       - PF=0

JNS     -        Jump if sign flag not set                         - SF=0

JNZ     -        Jump if not zero                                    - ZF=0

JO       -        Jump if overflow flag is set                     - OF=1

JP       -        Jump if parity flag set                            - PF=1

JPE     -        Jump if parity is equal                            - PF=1

JPO     -        Jump if parity is odd                              - PF=0

JS       -        Jump if sign flag is set                            - SF=1

JZ       -        Jump if zero                                         - ZF=1


---------------------------------------------------------------------------------------------


     LEA (Load Effective Address)

     Syntax: LEA dest,src


     LEA can be treated the same way as the MOV instruction. It isn't used too much for its

     original function, but more for quick multiplications like this:


     lea eax, dword ptr [4*ecx+ebx]

     which gives eax the value of 4*ecx+ebx


---------------------------------------------------------------------------------------------


     MOV (Move)

     Syntax: MOV dest,src


     This is an easy to understand instruction. MOV copies the value from src to dest and src

     stays what it was before.


     There are some variants of MOV:


     MOVS/MOVSB/MOVSW/MOVSD EDI, ESI: Those variants copy the byte/word/dword ESI points to,

to the space EDI points to.


     MOVSX:   MOVSX expands Byte or Word operands to Word or Dword size and keeps the sign of the

value.


     MOVZX:   MOVZX expands Byte or Word operands to Word or Dword size and fills the rest of the

space with 0.


---------------------------------------------------------------------------------------------


     MUL (Multiplication)

     Syntax: MUL value


     This instruction is the same as IMUL, except that it multiplies unsigned. It can set the

     O/Z/F flags.


---------------------------------------------------------------------------------------------


     NOP (No Operation)

     Syntax: NOP


     This instruction does absolutely nothing

     That's the reason why it is used so often in reversing ;)


---------------------------------------------------------------------------------------------


     OR (Logical Inclusive Or)

     Syntax: OR dest,src


     The OR instruction connects two values using the logical inclusive or.

     This instruction clears the O-Flag and the C-Flag and can set the Z-Flag.


     To understand OR better, consider those two binary values:


                                    1001010110

                                    0101001101


     If you OR them, the result is 1101011111


     Only when there are two 0 on top of each other, the resulting bit is 0. Else the resulting

     bit is 1. You can use calc.exe to calculate OR. I hope you understand why, else

     write down a value on paper and try ;)


---------------------------------------------------------------------------------------------


     POP

     Syntax: POP dest


     POP loads the value of byte/word/dword ptr [esp] and puts it into dest. Additionally it

     increases the stack by the size of the value that was popped of the stack, so that the next

     POP would get the next value.


---------------------------------------------------------------------------------------------


     PUSH

     Syntax: PUSH operand


     PUSH is the opposite of POP. It stores a value on the stack and decreases it by the size

     of the operand that was pushed, so that ESP points to the value that was PUSHed.


---------------------------------------------------------------------------------------------


    REP/REPE/REPZ/REPNE/REPNZ

     Syntax: REP/REPE/REPZ/REPNE/REPNZ ins


     Repeat Following String Instruction: Repeats ins until CX=0 or until indicated condition

     (ZF=1, ZF=1, ZF=0, ZF=0) is met. The ins value must be a string operation such as CMPS, INS,

     LODS, MOVS, OUTS, SCAS, or STOS.


---------------------------------------------------------------------------------------------


     RET (Return)

     Syntax: RET

             RET digit


     RET does nothing but return from a part of code that was reached using a CALL instruction.

     RET digit cleans the stack before it returns.


---------------------------------------------------------------------------------------------


     SUB (Subtraction)

     Syntax: SUB dest,src


     SUB is the opposite of the ADD command. It subtracts the value of src from the value of

     dest and stores the result in dest.


     SUB can set the Z/O/C flags.


---------------------------------------------------------------------------------------------


     TEST

     Syntax: TEST operand1, operand2


     This instruction is in 99% of all cases used for "TEST EAX, EAX". It performs a Logical

     AND(AND instruction) but does not save the values. It only sets the Z-Flag, when EAX is 0

     or clears it, when EAX is not 0. The O/C flags are always cleared.


---------------------------------------------------------------------------------------------


     XOR

     Syntax: XOR dest,src


     The XOR instruction connects two values using logical exclusive OR (remember OR uses

     inclusive OR).


     This instruction clears the O-Flag and the C-Flag and can set the Z-Flag.

     To understand XOR better, consider those two binary values:


                                    1001010110

                                    0101001101


     If you OR them, the result is 1100011011


     When two bits on top of each other are equal, the resulting bit is 0. Else the resulting

     bit is 1. You can use calc.exe to calculate XOR.

     The most often seen use of XOR is “XOR, EAX, EAX”. This will set EAX to 0, because when

     you XOR a value with itself, the result is always 0. I hope you understand why, else

     write down a value on paper and try ;)


---------------------------------------------------------------------------------------------


VII.  Logical Operations


Here follow the most used in a reference table.
 
 
                   Reference Table
 
     operation        src     dest    result
        AND            1        1       1
                       1        0       0
                       0        1       0
                       0        0       0   
        OR             1        1       1
                       1        0       1
                       0        1       1
                       0        0       0   
        XOR            1        1       0
                       1        0       1
                       0        1       1
                       0        0       0  
        NOT            0       N/A      1
                       1       N/A      0  


---------------------------------------------------------------------------------------------


Yep, indeed, this is already the END J Sorry if there are mistakes in this text.


'Hacking' 카테고리의 다른 글

SQL injection  (0) 2008.11.12
TCP flags  (0) 2008.11.07
Basic of Reverse Engineering  (0) 2008.11.06
CentOS Update Server and Local Repository  (0) 2008.10.31
OpenLDAP structure  (0) 2008.10.29
Posted by CEOinIRVINE
l